Do you want to know which ETFs are hot and which ones are not? Then you need my High-Volume ETF Cutline report. It tells you how close or far each of the 311 ETFs I follow is from its long-term trend line (39-week SMA). These are the ETFs that trade more than $5 million a day, so they are not some obscure funds that nobody cares about.
The report is split into two parts: The winners that are above their trend line (%M/A), and the losers that are below it. The yellow line is the line of shame that separates them. You can see how many ETFs are in each group and how they have changed since the last report (259 vs. 265 current).
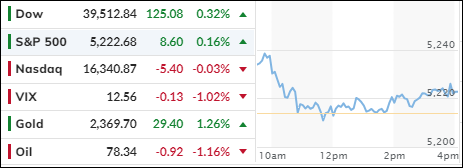
DOW AND S&P 500 RISE AMIDST ECONOMIC UNCERTAINTY AND INFLATION WOES
[Chart courtesy of MarketWatch.com]
Moving the markets
In the intricate dance of the stock market, this week presented a mixed tableau. The Dow and the S&P 500, like seasoned performers, managed to spin around to another session of gains amidst a backdrop of economic uncertainty. This performance, however, was not without its counterpoints.
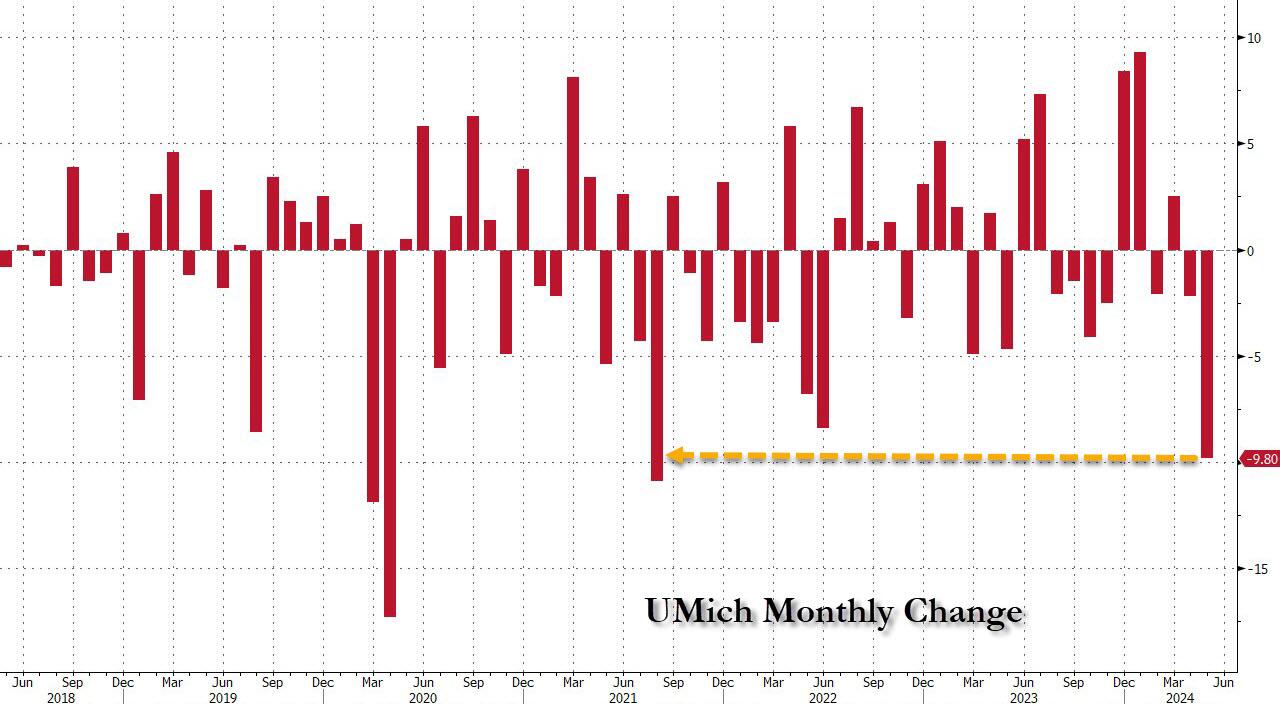
The market’s rhythm was disrupted by the latest consumer sentiment data, which plummeted unexpectedly, signaling a surge in inflation expectations. The University of Michigan’s preliminary consumer sentiment index for May dropped to 67.4, a stark contrast to the Dow Jones estimates of 76 and the lowest in half a year. This data painted a grim picture, suggesting that public perception of the economy is deteriorating, with inflation worries at the forefront of collective concern.
This sentiment has implications for the Federal Reserve’s monetary policy. The central bank’s decisions on interest rates will likely be swayed by the degree of slowdown observed in consumer spending and employment. Yet, if these indicators do not plummet precipitously, it may provide just enough positive sentiment to buoy the markets, which are keenly anticipating rate cuts.
In a recent twist, traders have adopted a more optimistic outlook after signals from the Federal Reserve suggested that an interest rate hike is off the table for the next move. This has led to speculation that interest rates may have reached their peak, a scenario that could prove advantageous for equities.
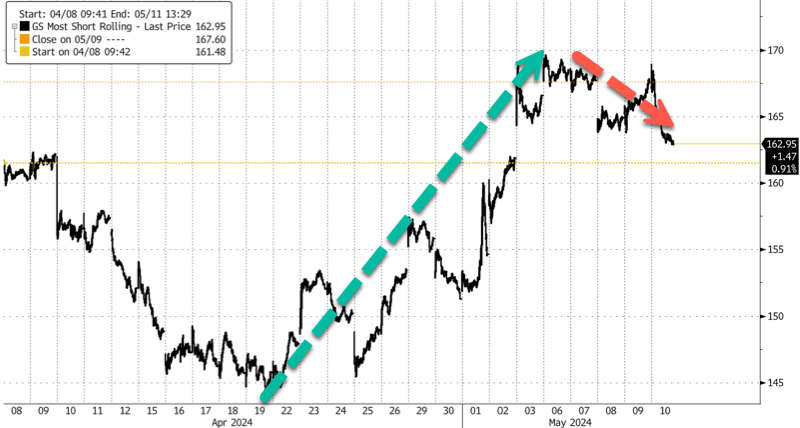
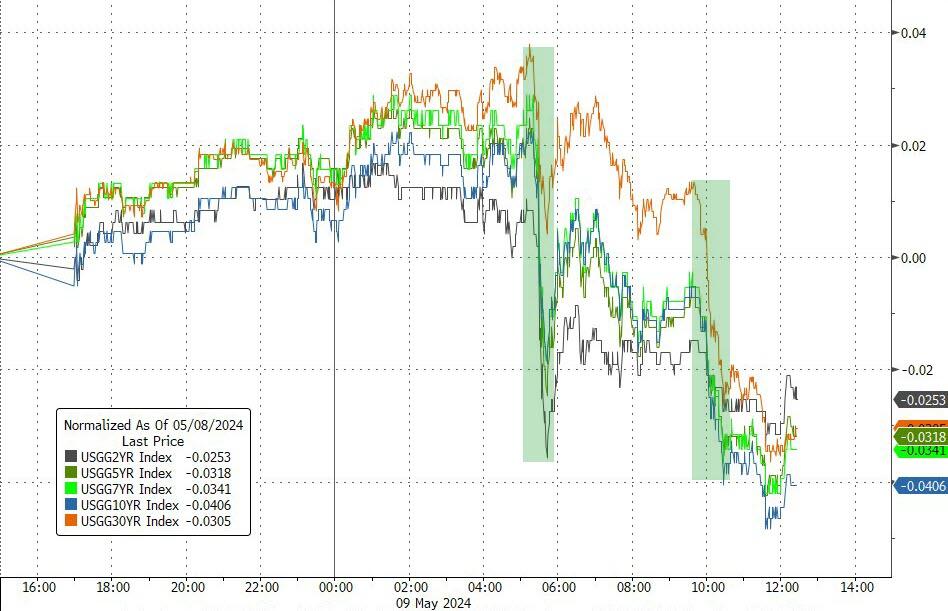
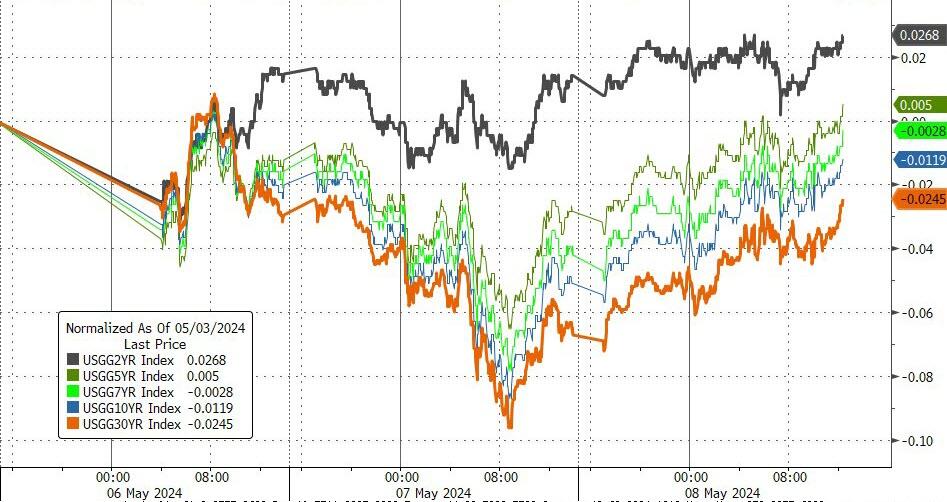
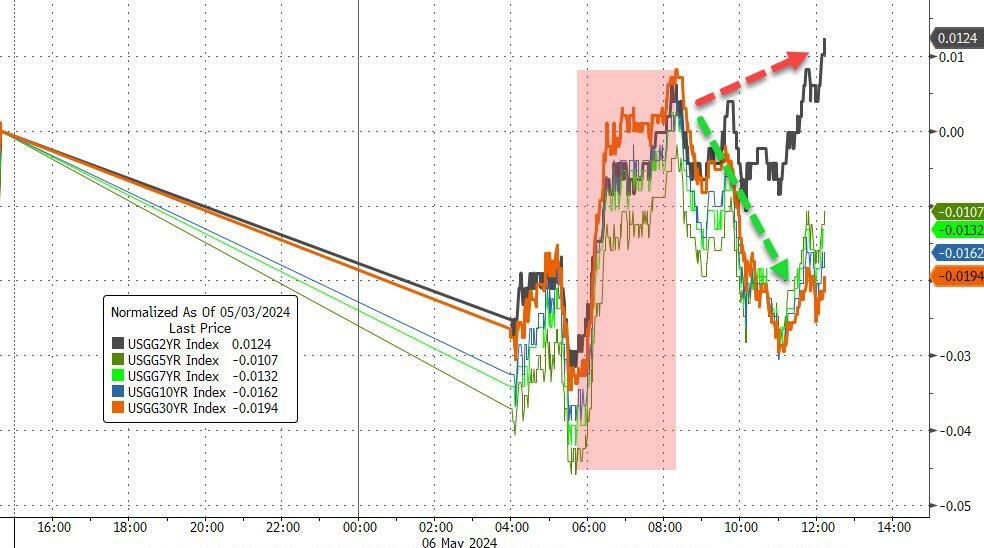
However, the week concluded with a loss of momentum for the most heavily shorted stocks, while bond yields, particularly the closely monitored 10-year yield, climbed past the 4.5% mark due to persistent inflationary pressures. This renewed the focus on the possibility of a “higher for longer” interest rate environment.
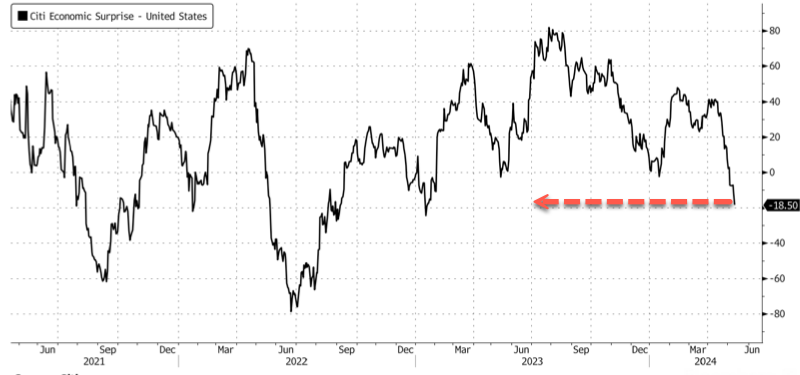
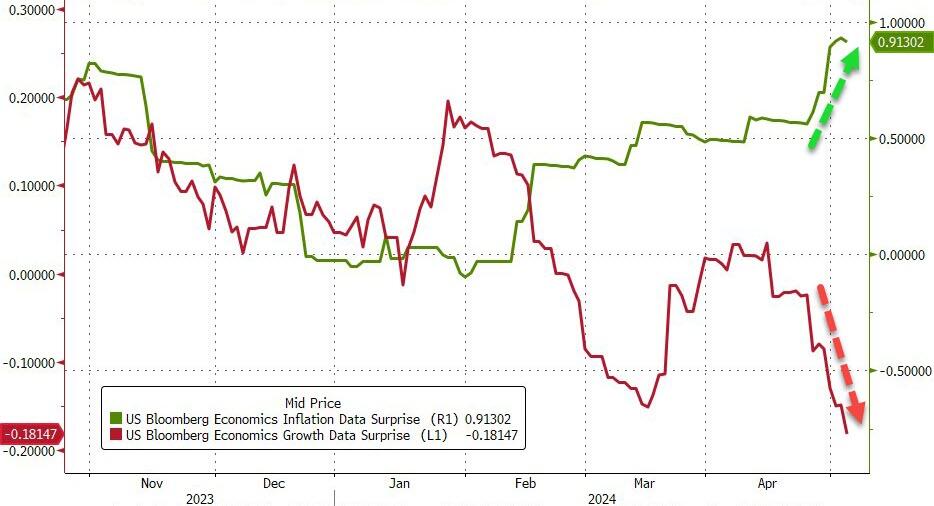
Amidst these developments, the Citi Economic Surprise Index fell to its lowest level since January 2023, hinting at economic fragility. This combination of weak or nonexistent economic growth coupled with inflation resurrects the specter of “Stagflation.”
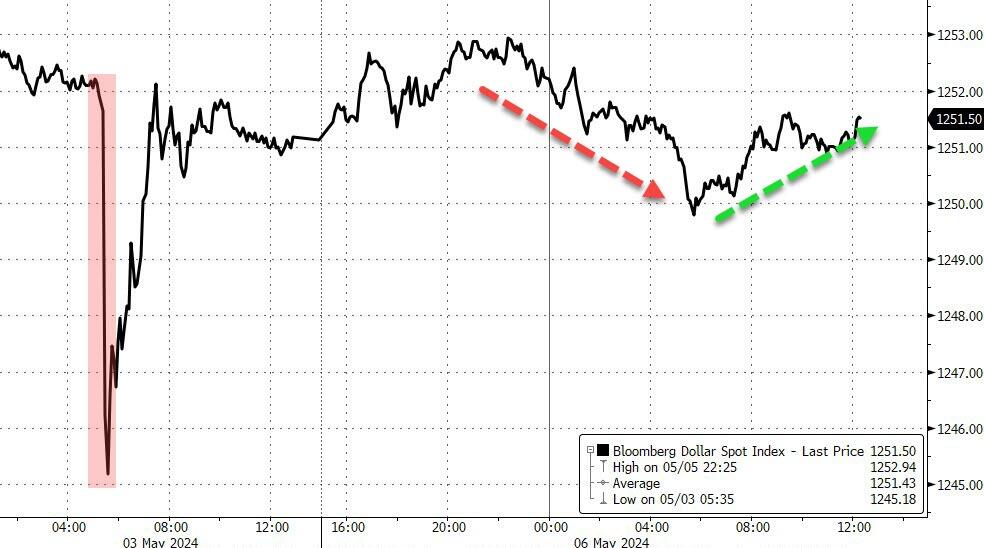
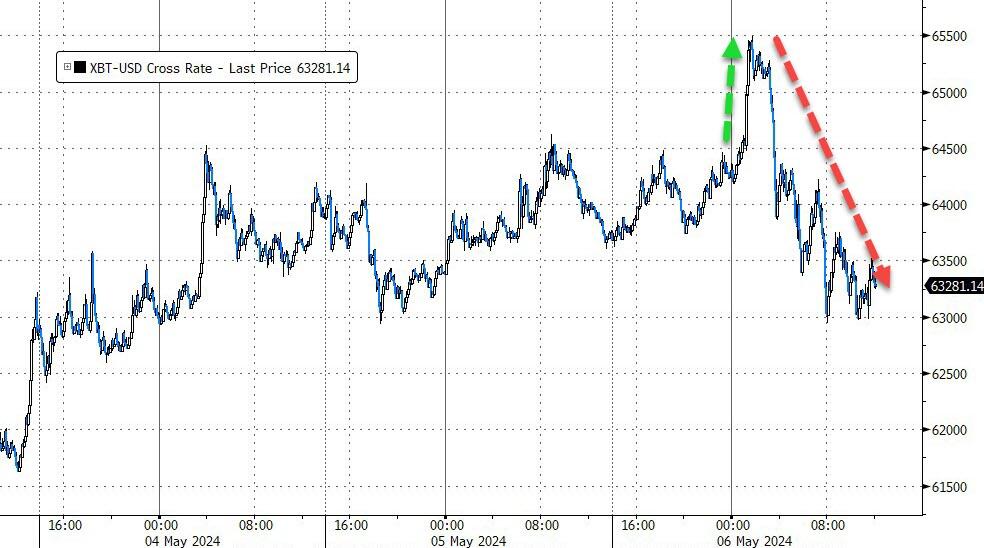
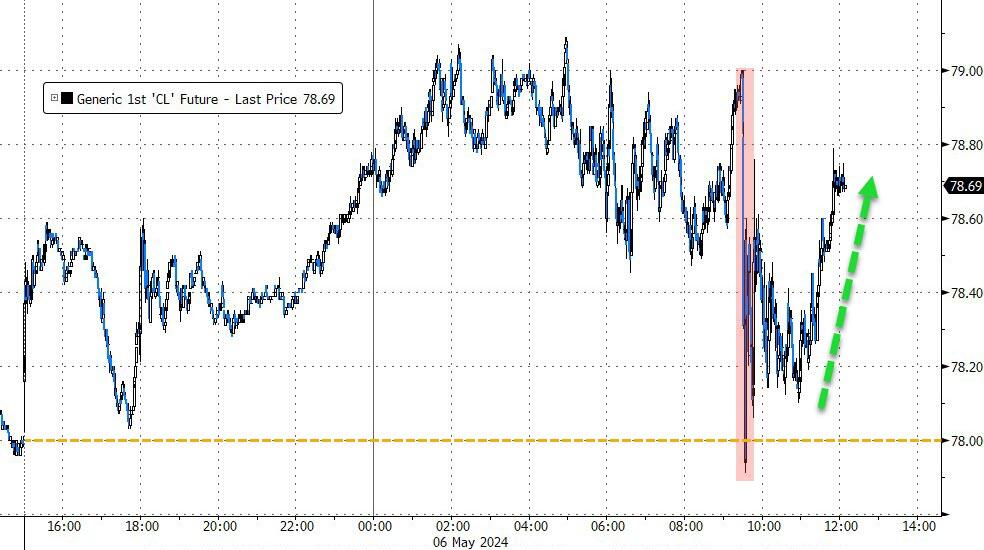
The repercussions were felt across various assets, with Bitcoin and crude oil prices declining, while the dollar experienced an upswing. With a critical week ahead, featuring key economic data releases such as the Consumer Price Index (CPI), Producer Price Index (PPI), retail sales, and industrial production, the market stands at a crossroads.
As we anticipate these significant data points, one can’t help but wonder:
Will any of these upcoming revelations prove to be a catalyst for market optimism?
Out of the 1,800+ ETFs out there, I only pick the ones that trade over $5 million per day (HV ETFs), so you don’t get stuck with a lemon that nobody wants to buy or sell.
Trend Tracking Indexes (TTIs)
These are the main indicators that tell you when to buy or sell Domestic and International ETFs (section 1 and 2). They do that by comparing their position to their long-term M/A (Moving Average). If they cross above, and stay there, it’s a green light to buy. If they fall below, and keep going, it’s a red light to sell. And to make sure you don’t lose your shirt if things go south, I also use a 12% trailing stop loss on all positions in these categories.
All other investment areas don’t have a TTI and should be traded based on the position of each ETF relative to its own trend line (%M/A). That’s why I call them “Selective Buy.” In other words, if an ETF goes above its own trend line, you can buy it. But don’t forget to use a trailing sell stop of 12%, or less if you’re feeling nervous.
If some of these words sound like Greek to you, please check out the Glossary of Terms and new subscriber information in section 9.
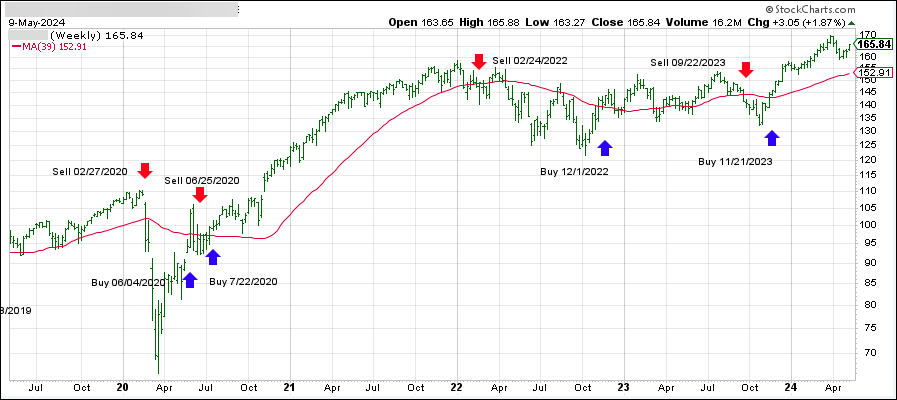
DOMESTIC EQUITY ETFs: BUY— since 11/21/2023
Click on chart to enlarge
This is our main compass, the Domestic Trend Tracking Index (TTI-green line in the above chart). It has broken above its long-term trend line (red) by +8.76% and is in “Buy” mode as posted.
Today’s stock market narrative unfolded with a cautiously optimistic tone as traders navigated through a landscape of mixed signals. Disappointing earnings reports cast a shadow, yet new economic data infused the markets with hope, suggesting the possibility of a more lenient Federal Reserve policy as the year progresses. This juxtaposition of concerns and expectations set the stage for the day’s trading activities.
The release of weekly jobless claims, which hit their highest mark since the previous August, painted a picture of potential economic cooling. This development fueled speculation among traders that the Federal Reserve might consider a reduction in interest rates to stimulate economic activity. Such a move is eagerly anticipated by market participants who are looking for signs of support in an uncertain economic environment.
The backdrop for today’s session was a market recovering from a period of turbulence. The Dow managed to extend its winning streak to six days, while the S&P 500 experienced a slight retreat, ending its five-day climb. The month of April had presented significant challenges, marking one of the toughest periods for the markets in recent memory. This difficult phase seemed to set the stage for the current market reactions, particularly in response to the latest earnings reports.
Attention was also directed towards the softer economic indicators, which could potentially provide the Federal Reserve with the justification needed to maintain a dovish stance—if bond yields remain stable. With yields holding steady today, traders interpreted these conditions as a signal to re-enter the market, leading to a surge in buying activity.
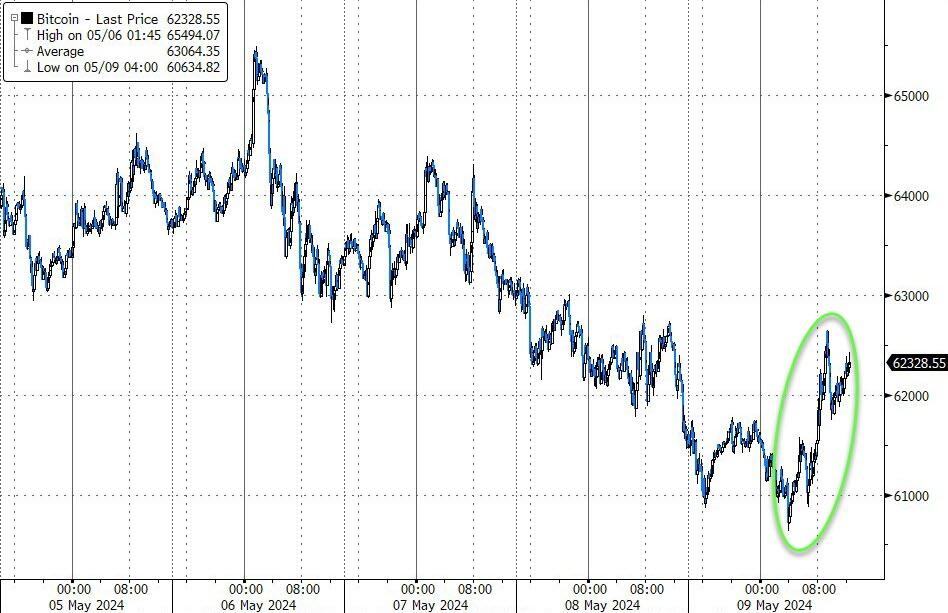
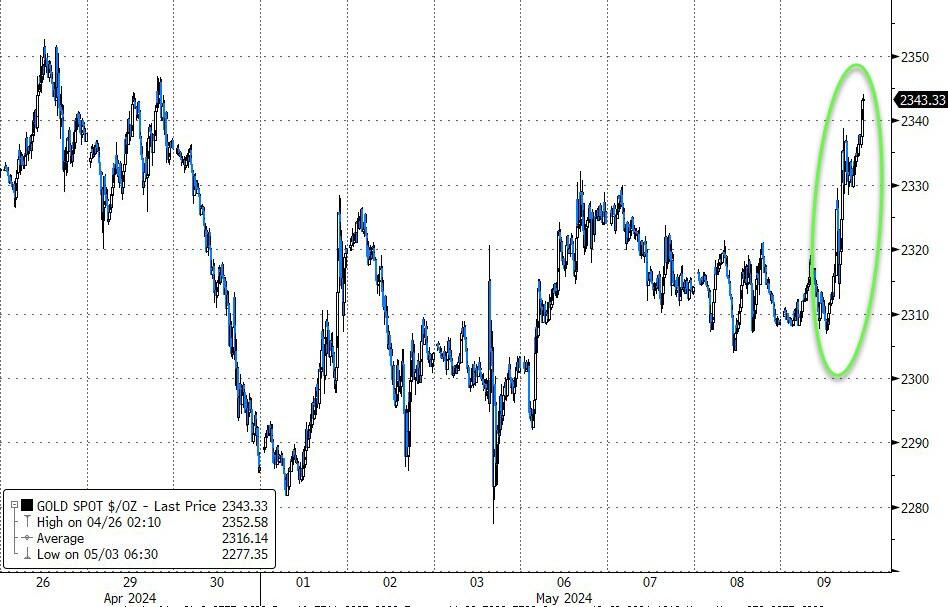
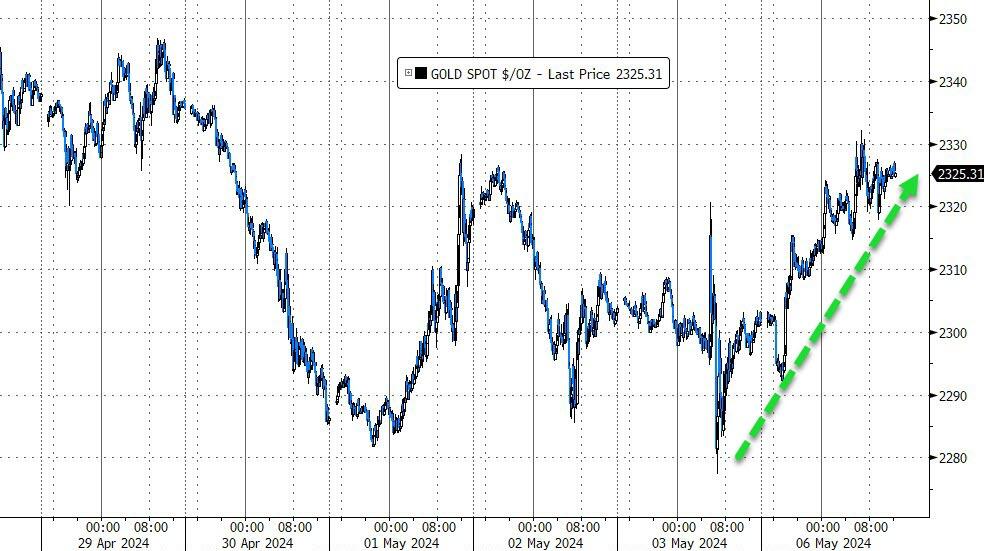
Meanwhile, bond yields saw a decline, Bitcoin experienced a resurgence, and the dollar faced a downturn. Gold emerged as the standout performer, soaring past the $2,350 mark, while crude oil prices remained relatively unchanged, albeit with a marginal increase.
This complex interplay of market forces raises a pivotal question:
Can the markets capitalize on today’s upward movement and sustain this momentum in the face of ongoing economic uncertainties?
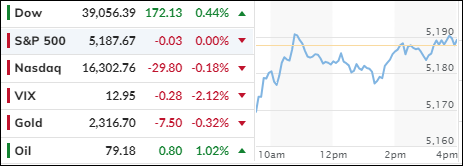
In today’s market, the major indexes experienced a slip due to pressure on several tech companies, causing both the Nasdaq and S&P 500 to break their recent winning streaks. However, there was an exception: the Dow managed to defy the trend and extend its winning streak to six days.
Specifically, Uber shares took a hit, plummeting by 8.5% after the rideshare company reported an unexpected net loss and weaker-than-anticipated bookings revenue. Meanwhile, Intel faced its own challenges, with a decline of over 2% following the chipmaker’s downward revision of second-quarter revenue guidance.
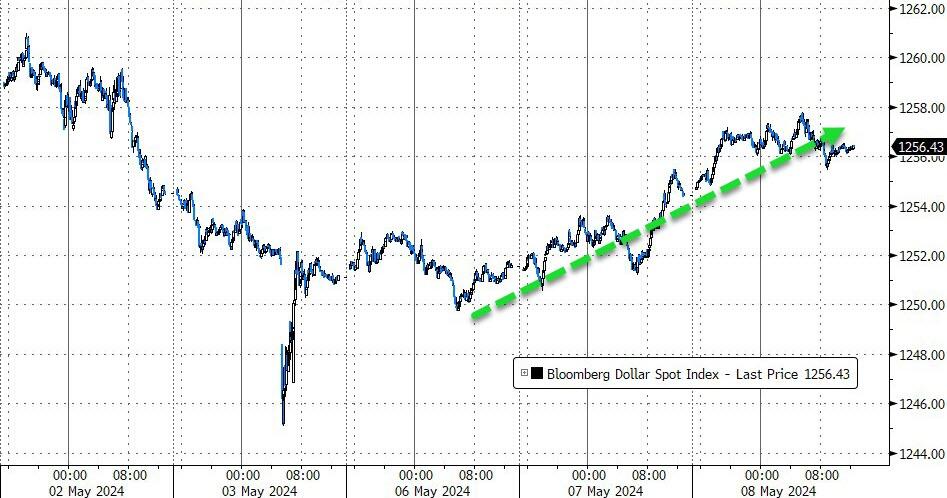
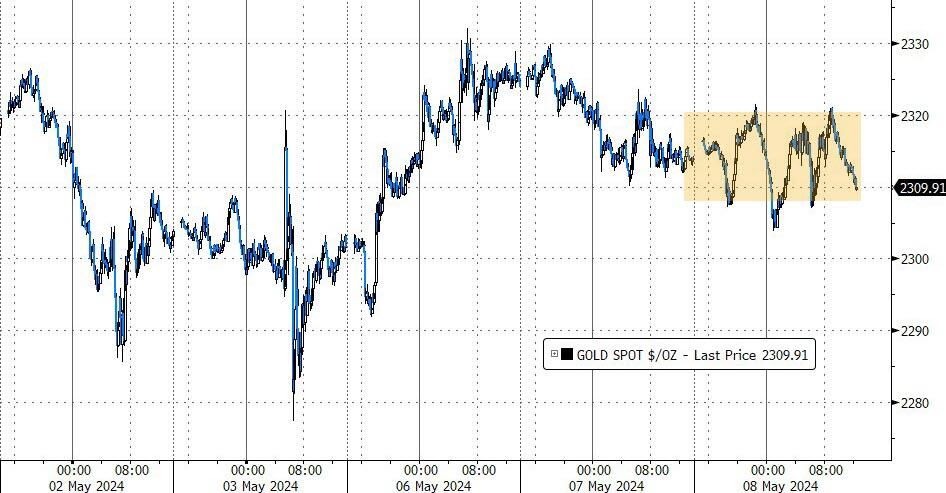
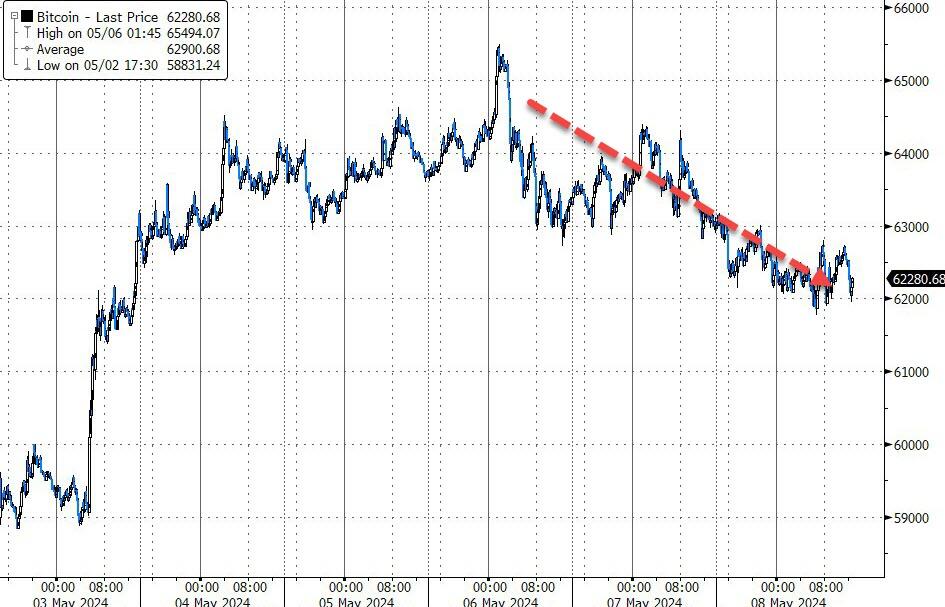
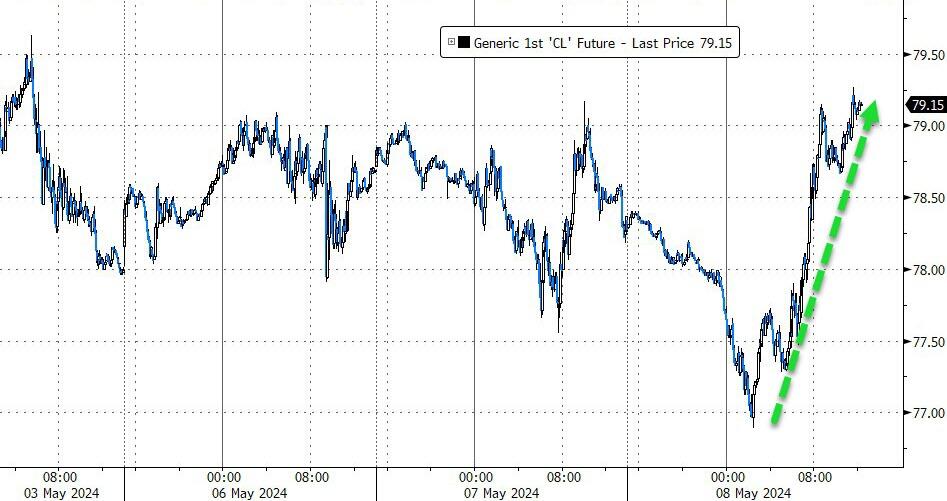
Investors also grappled with a barrage of Federal Reserve commentary. Boston Fed President Susan Collins emphasized that the Fed’s interest rate policy would likely remain unchanged until inflation shows sustainable movement toward the central bank’s 2% target. Because of this hawkish stance, buying interest remained lackluster, resulting in a meandering session as rate cut expectations dwindled.
In other market movements, bond yields inched higher, the dollar continued its rebound, and gold traded within a narrow range. Bitcoin, on the other hand, drifted lower. However, the standout performer of the day was crude oil, with WTI prices rotating back from below $77 to above $79.
Interestingly, Bank of America recently posted a reminder: “Don’t sell in May and go away.” This advice is rooted in the historical tendency for Presidential election years to witness significant summer rallies.
Now, the question remains: Will history repeat itself?
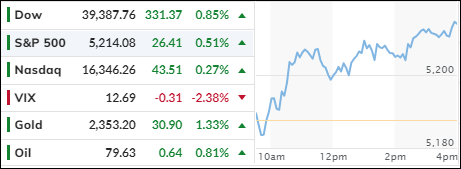
Today’s financial markets saw a continuation of growth, with major indexes like the S&P 500, and Nasdaq each climbing over 1% in value. This surge was fueled by the latest jobs report, which indicated slower-than-anticipated job growth in April and a slight uptick in unemployment rates. These figures have quelled concerns about an overheated economy and have sparked optimism among traders who now anticipate the Federal Reserve might lower interest rates sooner than expected.
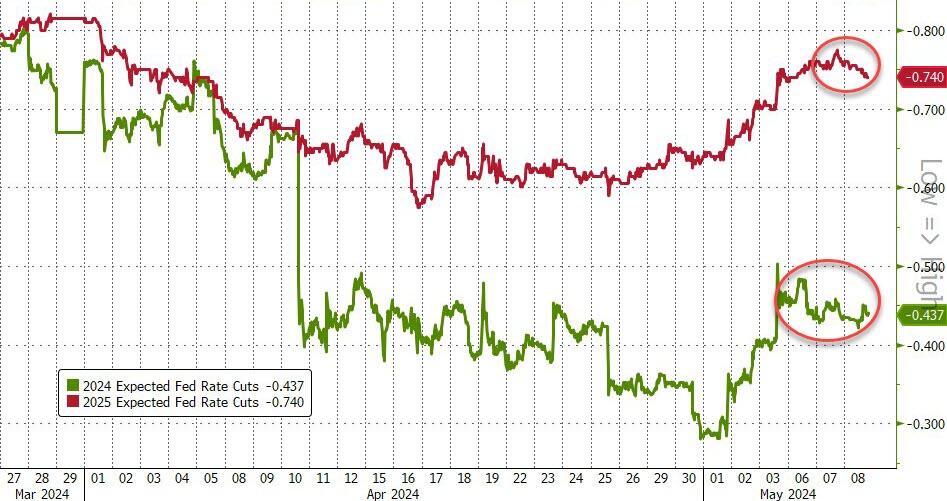
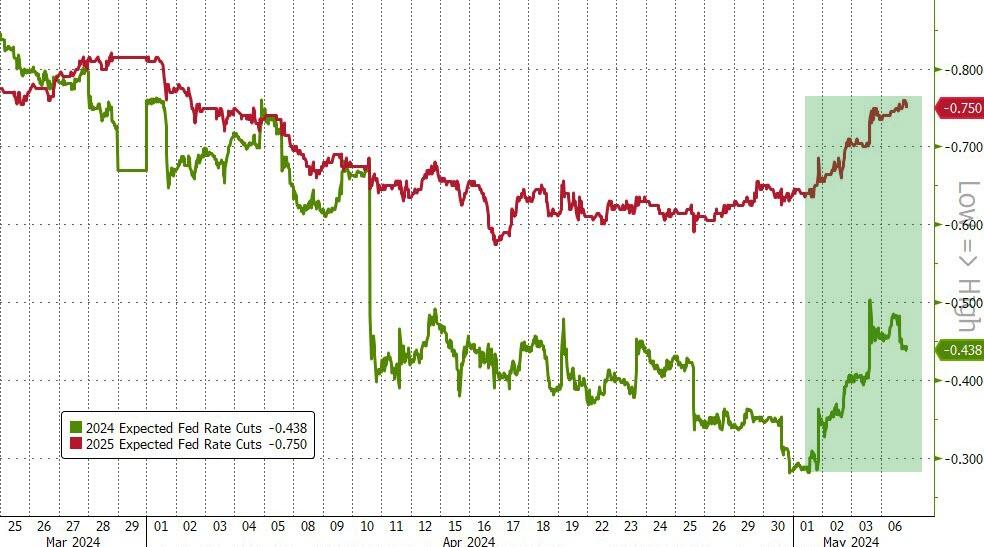
Despite the prevailing narrative of “stagflation” market participants are adjusting their expectations, factoring in two potential rate cuts in 2024 and an additional three in 2025. As the first-quarter earnings season winds down, attention shifts to the forthcoming financial disclosures from prominent companies such as Disney and Uber, scheduled for this week.
During this, the market dynamics have been diverse: Small Caps have outshined, continuing their robust performance, while the MAG7 stocks have also seen an upward trajectory. However, the Dow experienced a slight lag in comparison.
The bond market showed mixed results, the dollar remained relatively stable, and Bitcoin experienced a rally before encountering a setback due to regulatory actions involving Robinhood. Meanwhile, oil prices fluctuated significantly, and gold prices built upon the previous week’s gains.
Amidst the market’s positive outlook, a note of caution arises from Warren Buffet’s recent actions. Known for his astute market insights, Buffet has amassed a record-breaking cash reserve of approximately $180 billion, signaling a potential warning to investors.
This raises the question: Is Warren Buffet anticipating a scenario that others on Wall Street are overlooking?


