
ETFs/Mutual Funds On The Cutline – Updated Through 12/28/2012

Ulli ETFs on the Cutline Contact

Below are the latest ETF Cutline reports, which show how far above or below their respective long-term trend lines (39 week SMA) my currently tracked ETFs/MFs are positioned.

The first report covers the ETF Master List from Thursday’s StatSheet and includes 398 ETFs, of which currently 300 (last week 349) of them are hovering in bullish territory.

The second report includes only High Volume ETFs. To clarify, High Volume (HV) ETFs are defined as those with an average daily volume of $10 million or higher.

These ETFs are generated from my selected list of some 93 that I use in my advisor practice. It cuts out the “noise,” which simply means it eliminates those ETFs that I would never buy because of their volume limitations. 71 ETFs (last week 82) have managed to remain in bullish territory after the recent market volatility.

The third report covers Mutual Funds on the Cutline. There are currently 562 (last week 700) above the line and 297 below it out of the 859 that I follow.

Take a look:

1. ETF Master Cutline Report

2. ETF High Volume Cutline Report

3. MF Cutline Report

In case you are not familiar with some of the terminology used in the reports, please read the Glossary of Terms.

Last Week In Review: ETF News And Blog Posts To 12/30/2012

Ulli Market Review Contact

In case you missed it, here’s a summary of the ETF topics and market reviews I posted to my blog during the week ending on 12/30/2012.

Hope for a fiscal cliff rescue package finally fizzled out, and the markets slipped with the S&P 500 surrendering some 2% during this holiday shortened week. More meetings are planned, but odds are low that anything meaningful will be accomplished.

Some watered down version of a cliff compromise will do nothing to resolve the issues at hand and will only be another can kicking exercise. The markets may have finally woken up to that fact and may not react too kindly to any such attempt of avoiding reality.

I am sticking to my long-held view that it will take a 20% or higher drop in the markets to get Washington’s finest to become serious about attacking the issues that ail us.

Over past week, we covered the following:

Read More

One Man’s Opinion: Will The Housing Market Recover In The Next Three Years?

Ulli Housing Market Contact

The US housing market continues to be on the mend and 2012 may go down as the year when housing prices came back to life. Trulia Inc’s Jed Kolko says the numbers will continue to improve and the latest Case-Shiller number seems to back up his claim, as housing prices across 20 cities rose the most in two years in November.

But we are still only half-way back to normal in housing recovery and that’s still a long way from normal, Jed noted. The housing market really bottomed sometime in 2009. That was the low point for sales, construction, delinquencies and foreclosures and it has taken us three years to get even half-way back to normal. But that’s still lot better than anyone thought we would be by the end of the year, he added.

Asked to define normal, he said when he looks at normal, he looks at historical normal before the bubble and the bust. Of course there was no specific moment when the housing market was normal, but it certainly wasn’t normal in 2005-2006 as prices were incredibly high and there was more construction than the markets could absorb.

Asked if the housing market between 1999 and 2003 could be termed as normal by looking at the growth-rate during that period of time and then extrapolating them to find out where we should be today theoretically, Jed said before the bubble and the bust, the major indicators like construction and sales tended to be more stable than what has been seen in the last decade.

Read More

New ETFs On The Block: Flexshares Unveils Three Dividend ETFs

Ulli Dividend ETFs Contact

FlexShares, the Portland, ME-based ETF issuing arm of Northern Trust, has launched three dividend products for investors seeking income-generating options in this low yield environment. The products may come handy for various investors since many companies are planning last minute dividends to reduce their own tax liabilities as going over the fiscal cliff looks almost certain now.

The FlexShares Quality Dividend Index Fund (QDF) replicates the performance of the Northern Trust Quality Dividend Index (the underlying index), the benchmark designed to provide exposure to a high-quality portfolio of long-only US equity securities with a targeted overall beta that is similar to the Northern Trust 1250 Index, or the parent index.

Companies included in the index are selected based on fundamental factors such as profitability, management reputation and cash-flow history, along with other factors such as expected dividend payout amount. The underlying index for this passively-managed fund is reconstituted every quarter.

Read More

ETF/No Load Fund Tracker Newsletter For Friday, December 28, 2012

Ulli ETF Tracker Contact

ETF/No Load Fund Tracker StatSheet

————————————————————-

THE LINK TO OUR CURRENT ETF/MUTUAL FUND STATSHEET IS:

https://theetfbully.com/2012/12/weekly-statsheet-for-the-etfno-load-fund-tracker-newsletter-updated-through-12272012/

————————————————————

Market Commentary

Friday, December 28, 2012

US STOCKS SINK AS BUDGET IMPASSE CONTINUES; EUROPE TRACKS LOWER

US stocks dropped for the fifth straight day, the longest losing streak for the Dow Jones Industrial Average since July, ending the week off nearly two percent after a report suggested President Barack Obama and Republicans failed to strike a deal to avert the so-called fiscal cliff Friday afternoon.

There was little reaction to better-than-expected economic news as investors followed the efforts to cut a last-minute budget deal. Pending home sales climbed for a third month in November, the National Association of Realtors announced.

A separate report showed business activity in the US expanded in December for the second straight month. The Chicago purchasing managers index rose to a four month high of 51.6 from 50.4 in November, easing concerns of a manufacturing slump due to the ongoing budget stalemate.

Read More

Weekly StatSheet For The ETF/No Load Fund Tracker Newsletter – Updated Through 12/27/2012

Ulli ETF StatSheet Contact

ETF/Mutual Fund Data updated through Wednesday, December 27, 2012

If you are not familiar with some of the terminology used, please see the Glossary of Terms.


1. DOMESTIC EQUITY MUTUAL FUNDS/ETFs: BUY — since 10/25/2011

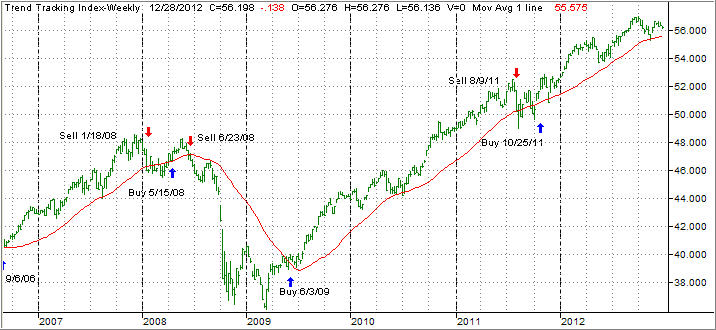
The domestic TTI broke through its long-term trend line generating a Sell for this area effective 8/9/2011. Over the recent past, we’ve seen the TTI hovering slightly below and above this dividing line between bullish and bearish territory. The clear break to the upside occurred on 10/24/11 and, effective 10/25/11, a new Buy signal for domestic equities went into effect.

As of today, our Trend Tracking Index (TTI—green line in above chart) has bounced off its long term trend line (red) by +1.18% after recently having dipped slightly below it.

To avoid a potential whip-saw, a Sell signal to move out of all domestic equity positions will be generated once we have clearly pierced the line to the downside. Be sure to tune into my blog for the latest updates.

Read More