US Indexes Break Below Major Milestone Levels As Italy And Sequestration Hit

Ulli Market Commentary Contact

Mon pic

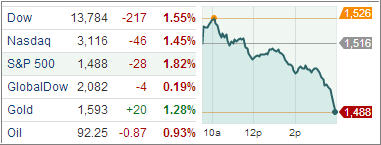
[Chart courtesy of MarketWatch.com]

US stocks turned severely lower, with the Dow Industrials and the S&P 500 suffering their sharpest one-day decline of the year, giving benchmark indexes the biggest loss since November as political instability in Italy and looming spending cuts in the US hit investor sentiment.

Stocks erased early gains as partial election results suggested Italy may be left with a hung parliament as a strong performance by former Prime Minister Silvio Berlusconi may have given him a blocking minority to deny victory to the center-left coalition of Pier Luigi Bersani. Berlusconi’s coalition is seen as a threat to the nation’s austerity agenda while Bersani has campaigned to maintain the budget rigor of outgoing Prime Minister Mario Monti.

Stocks had pushed higher earlier on wagers Japanese Prime Minister Shinzo Abe will nominate a central bank chief who favors further monetary stimulus to haul the economy out of a 20-year long deflation.

Read More

ETFs/Mutual Funds On The Cutline – Updated Through 2/22/2013

Ulli ETFs on the Cutline Contact

Below are the latest ETF Cutline reports, which show how far above or below their respective long-term trend lines (39 week SMA) my currently tracked ETFs/MFs are positioned.

The first report covers the ETF Master List from Thursday’s StatSheet and includes 398 ETFs, of which currently 354 (last week 359) of them are hovering in bullish territory.

The second report includes only High Volume ETFs. To clarify, High Volume (HV) ETFs are defined as those with an average daily volume of $10 million or higher.

These ETFs are generated from my selected list of some 93 that I use in my advisor practice. It cuts out the “noise,” which simply means it eliminates those ETFs that I would never buy because of their volume limitations. 80 ETFs (last week 82) have managed to remain in bullish territory after the recent market volatility.

The third report covers Mutual Funds on the Cutline. There are currently 801 (last week 808) above the line and 58 below it out of the 859 that I follow.

Take a look:

1. ETF Master Cutline Report

2. ETF High Volume Cutline Report

3. MF Cutline Report

In case you are not familiar with some of the terminology used in the reports, please read the Glossary of Terms.

Last Week In Review: ETF News And Blog Posts To 2/24/2013

Ulli Market Review Contact

In case you missed it, here’s a summary of the ETF topics and market reviews I posted to my blog during the week ending on 2/24/2013.

Last week, I was talking about the tight trading range of the S&P 500 index and that eventually a breakout would occur. Last Wednesday, assisted by a potential threat that the Fed may water down the spiked punch bowl  the markets sold off some modest 2% over 2 days.

Friday’s recovery cut the losses in half, and the benchmark index actually closed lower for the week but by only by a scant 0.3%. Surely, a sell off was way overdue, but it remains to be seen if there is more downside activity preventing the run to new highs.

The trigger for more selling may not necessarily come from within the US, but is likely to originate in Europe where economic conditions are worsening by the week with Spain, Italy and France being hard hit. Adding insult to injury are the bribery scandals in Spain and questionable past banking deals in Italy just to name a few.

At this time, it looks like the previously considered core countries of Italy, Spain and France are anything but stable leaving only Germany as the ultimate paymaster. I don’t know when things will fall apart, but I doubt that we will see the EU making it through this year in its current status.

Over past week, we covered the following:

Read More

One Man’s Opinion: Will Demand From Traditional Home-Owners Continue The Housing Recovery?

Ulli Market Commentary Contact

92835431The latest round of economic data sends out mixed signal about the US economy. The Philly Fed’s General Economic Index fell to minus 12.5 in February, the lowest since June, from minus 5.8 in January. Does this mean the nation’s economic concerns are more regional than national?

Not exactly, says Mark Zandi, chief economist at Moody’s Analytics Inc. The concerns are across the board although the Filly Fed Index has been unusually volatile, up and down and all around in recent months. Since last year this time, the index has been on the soft side, suggesting manufacturing, particularly in the middle line equation, has been a bit weak. But the concerns are there across the country, they are not just in the Philadelphia district or in California, but they are coast-to-coast, he observed.

The minutes from the Federal Reserve’s latest policy meeting seem to indicate the central bank is considering how to bring an end to assets purchases, the “quantitative easing.” The markets turned lower on that news on Thursday.

Asked what that selling pressure means for financial markets that were hoping to ride the wave of quantitative easing to all time highs this year, Mark said QE has been very important for the stock market and the bond markets and the expectation had been that the Fed would continue with the quantitative easing policy at least through the end of the year and probably into next.

Read More

New ETFs On The Block: Market Vectors BDC Income ETF (BIZD)

Ulli Dividend ETFs Contact

146026450Market Vectors, the fifth-largest US issuer of exchange-traded products sponsored by Van Eck Global, has launched the Mar Vectors BDC Income ETF (BIZD), the first exchanged-traded fund designed to offer pure-play exposure to business development companies (BDCs).

Business development companies generate income by lending to, and investing in, privately-held or thinly traded public companies that tend to be below investment-grade or not rated. BIZD seeks to replicate, before fees and expenses, the Market Vectors US Business Development Companies Index (MVBIZDTG), a rules-based index intended to track the overall performance of publicly traded business development companies.

To qualify for the index, a BDC must have a market capitalization in excess of $150 million, a three-month average daily trading volume of more than $1million if listed, and a minimum trading volume of 250,000 shares each month in the previous six months.

BDCs are known for high dividend payouts and offer investors a chance to gain exposure in senior secured debt, mezzanine debt, private equity and other exotic layers of capital structure traditionally available to institutional investors.

Read More

02-22-2013

Ulli Newsletter Archives Contact

ETF/No Load Fund Tracker Newsletter For Friday, February 22, 2013

ETF/No Load Fund Tracker StatSheet

————————————————————-

THE LINK TO OUR CURRENT ETF/MUTUAL FUND STATSHEET IS:

https://theetfbully.com/2013/02/weekly-statsheet-for-the-etfno-load-fund-tracker-newsletter-updated-through-02212013/

————————————————————

Market Commentary

Friday, February 22, 2013

US STOCKS RALLY ON GERMAN DATA, EARNINGS; EUROPE SURGES

US stocks fought back from the worst slump since November as a measure of German business confidence jumped to a 10-month high, eclipsing concerns that the US Federal Reserve will scale back its asset purchase program, as earnings from American International Group Inc and Hewlett-Packard Co topped street estimates.

Wall Street found early support after suffering its worst two-drop since early November after the IFO survey of German business executives showed sentiment in February jumped to its highest reading since April.

Hewlett-Packard was the biggest gainer in the S&P 500 Friday, vaulting 12 percent after the largest PC maker forecast second quarter earnings that exceeded analysts’ expectations.

AIG Group rose 3.1 percent after fourth-quarter results beat analysts’ estimates.

The Dow Jones Industrial Average (DJIA) zoomed 120 points to finish at 14,001, leaving it up 0.1 percent for the week.

The S&P 500 Index (SPX) rose 13 points to 1,516 with materials, financials and technology leading the gains. All the 10 business groups within the benchmark index ended higher for the day. SPX shed 0.3 percent for the week, its first weekly decline of the year.

Treasury prices rose for a third day, pushing yields on 10-year notes to near one-week low on Friday ahead of Fed Chairman Ben Bernanke’s scheduled testimony before the Senate Banking Committee next week. Bernanke’s testimony will be important as the last FOMC minutes showed many Fed officials were worried about the risks linked to the $85 billion-a-month bond purchase program.

Meanwhile, the euro continued to weaken against the US dollar Friday, extending the currency’s losses against its US counterpart, after the European Central Bank said commercial banks would payback early less than half of the expected chunk of cheap three-year loans.

European stocks advanced, wrapping up its first weekly gain in four weeks on Friday after a surprisingly strong German reading on the country’s business climate spurred risk appetite, outweighing worries about Italian elections over the weekend.

On a downbeat note, the European Commission cut the currency bloc’s growth forecast for 2013. The eurozone’s economy is expected to shrink 0.3 percent this year as a return to growth seemed to be more gradual than expected.

Our Trend Tracking Indexes (TTIs) ended up only slightly changed from last week’s close:

Domestic TTI: +2.84% (last week +3.01%)

International TTI: +9.31% (last week +10.51%)

And, if you’re still not clear what Quantitative Easing (QE) is all about, or the Fed’s monthly $85 billion bond purchase program for that matter, take a look at this video (hat tip to Zero Hedge):

http://www.youtube.com/watch?feature=player_embedded&v=XrJHzbl7ay0

Have a great week.

Ulli…

————————————————————-

READER Q & A FOR THE WEEK

All Reader Q & A’s are listed at our web site!
Check it out at:

http://www.successful-investment.com/q&a.php

A note from reader Semserus:

Q: Ulli: Glad to See You around…!

YOU wrote: “exit our positions whenever our trailing sell stops give us the sign to do so.”

I have a question:

Please give Me YOUR definition of Said EXIT … Is it Like 5% down or 7% … or???

A: Semserus: I use the following trailing sell stop points:

1. Bond Funds/ETFs: 5%
2. Broadly diversified Domestic/International funds/ETFs: 7%
3. Country/Sector ETFs: 10%

Hope that helps.

———————————————————-

WOULD YOU LIKE TO HAVE YOUR INVESTMENTS PROFESSIONALLY MANAGED?

Do you have the time to follow our investment plans yourself? If you are a busy professional who would like to have his portfolio managed using our methodology, please contact me directly or get more details at:

https://theetfbully.com/personal-investment-management/

———————————————————

Back issues of the ETF/No Load Fund Tracker are available on the web at:

https://theetfbully.com/newsletter-archives/