7 ETF Model Portfolios You Can Use – Updated through 4/16/2013

Ulli Model ETF Portfolios Contact

Monday’s dump fest was a stark reminder that all is not well in equity land and that the S&P’s 1,600 level, which was almost reached last week, still needs continue upward momentum before it will be conquered.

Yesterday’s strong rebound, during which some our low volatility ETFs took out their previous highs, makes it easy to forget black Monday. Since last week’s ETF Model Portfolio report, the S&P managed to gain some 6 points while some of our models gained as well and others lost.

It’s no secret that the precious metals (PM) having a heck of time as they got taken out to the barn for a severe spanking over the past few trading days. Despite yesterday’s bounce, the jury is still out as to whether that was simply a dead cat bounce for PMs and equities alike or the continuation of the prior trend.

We are living not only in uncertain times, based on the ongoing federal stimulus, but also in times where unintended consequences can easily derail the best laid plans of the central planners. That means you always have to be alert and ready to execute your exit strategy should market momentum stall and head in the other direction.

In the meantime, here is the latest update for our Model ETF Portfolios, which you can use based on your risk tolerance:
Read More

The Day After… Index ETFs Recover From The Slump

Ulli Market Commentary Contact

Tue pic

[Chart courtesy of MarketWatch.com]

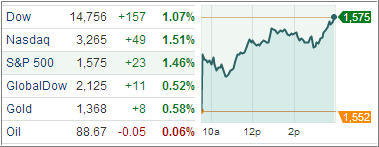
The market quietly opened higher today as the nation is still in shock of the bombings in Boston. Equities snapped back Tuesday after Monday’s nasty sell-off, cheered by better-than-expected March housing starts and a tame reading on consumer prices.

The Nasdaq led the way, rising 1.51%; the Standard & Poor’s 500 Index added 1.46%, rebounding from its biggest drop since November; and the Dow Jones Industrial Average picked up 1.1%. Early data showed NYSE and Nasdaq volume coming in lower than Monday, consistent with the market’s recent pattern of higher-volume declines and lower-volume gains.

All 10 industry groups advanced as raw-materials and consumer-staples companies gained the most, rising at least 1.7 percent thanks to two blue-chip companies announcing better than estimated earnings. Coca-Cola jumped 5.7 percent as Latin American sales volume increased. Johnson & Johnson added 2.1 percent as new drugs and the acquisition of Synthes Inc. boosted sales.

Read More

Let The Sell-Offs Begin…

Ulli Market Commentary Contact

Mon pic

[Chart courtesy of MarketWatch.com]

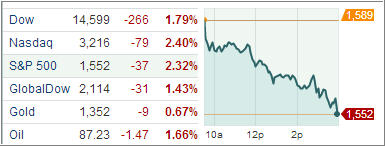
The week kicked off on a decidedly down note. Stocks sunk deep into the red on Monday. The major averages suffered sharp losses as the chart above shows. The S&P 500 posted its worst day in more than four months. As explosions rocked the finish line area of the Boston Marathon, stocks extended losses even further by closing bell. It was simply a bad day all the way around.

China’s economic growth unexpectedly slowed down. According to the Chinese National Bureau of Statistics, the country’s Gross Domestic Product rose 7.7 in the first quarter from a year earlier. The median forecast in a Bloomberg survey of economists was 8 percent. Fourth quarter growth was 7.9 percent. Many reports showed March industrial production rose less than estimated while retail-sales growth matched forecasts. Global growth is threatened as the Chinese numbers start to disappoint; after all, it’s supposed to be the little engine that could…

As fears of a slowdown in the world’s two biggest economies accelerated, prices of oil, gold, silver and other commodities tumbled. Mining and energy shares were hit hardest in the stock market today as the result. Gold was diving 9.5%, reaching at its lowest level since February 2011, falling $143 an ounce to $1,358.40. Silver was also slumping, shedding 11.8% to $23.23 an ounce. Shares of mining companies suffered astonishing selloffs. Many hit their 52-week lows, or worse. This sector is much weaker than the market overall, which was down in its own right.

Read More

ETFs/Mutual Funds On The Cutline – Updated Through 4/12/2013

Ulli ETFs on the Cutline Contact

Below are the latest ETF Cutline reports, which show how far above or below their respective long-term trend lines (39 week SMA) my currently tracked ETFs/MFs are positioned.

The first report covers the ETF Master List from Thursday’s StatSheet and includes 398 ETFs, of which currently 346 (last week 338) of them are hovering in bullish territory.

The second report includes only High Volume ETFs. To clarify, High Volume (HV) ETFs are defined as those with an average daily volume of $10 million or higher.

These ETFs are generated from my selected list of some 93 that I use in my advisor practice. It cuts out the “noise,” which simply means it eliminates those ETFs that I would never buy because of their volume limitations. 72 ETFs (last week 66) have managed to remain in bullish territory after the recent market volatility.

The third report covers Mutual Funds on the Cutline. There are currently 815 (last week 799) above the line and 44 below it out of the 859 that I follow.

Take a look:

1. ETF Master Cutline Report

2. ETF High Volume Cutline Report

3. MF Cutline Report

In case you are not familiar with some of the terminology used in the reports, please read the Glossary of Terms.

Last Week In Review: ETF News And Blog Posts To 4/14/2013

Ulli Market Review Contact

In case you missed it, here’s a summary of the ETF topics and market reviews I posted to my blog during the week ending on 4/14/2013.

It now looks like the major indexes only took a breather the prior week before continuing their ascent towards a new milestone marker during the past five trading days, which would be the 1,600 level for the S&P 500.

While we did not quite get there, the benchmark nevertheless added 2.3% and touched the 1,593 level before pulling back slightly. Given that fundamental data points show an opposite picture of what the stock market indicates, we know, as I posted many times, that the driver of these rallies is the Fed’s enormous monthly money printing effort.

Be that as it may, we will continue to track the long-term trend as long as this orgy lasts and will follow our sell stop points to the exit doors; whenever that moment in time arrives.

Over past week, we covered the following:

Read More

One Man’s Opinion: Can The US Economy Really Grow By Almost 3% In 2013?

Ulli Market Commentary Contact

92835431The recent plunge in gold prices indicate commodities are in the overbought region, and some kind of price pullback is likely to take place in near term, though there is some nervousness in the markets due to money-printing by global central banks, says Joe Quinlan, Chief Market Strategist at US Trust – Bank of America.

When questioned why he’s bullish on world economy, Joe said, barring Europe, the global economy has bottomed out. There’s no doubt that European problems will linger on, but they have been nearly offset by the US. Also, the emerging markets have started to recover. They have been easing monetary policies for the last 18 months, and the effects have started to kick in. Japan has started to recover and the world’s third largest economy will hopefully create some demand later. So essentially, growth should pick up by the second half of the year though we may see a pause in between. However, there could be more upswings in earnings, he observed.

Asked how 2013 is different from last year, when data started to become soft in the second quarter and continued to stay soft thereafter, Joe said retail and automobile sales are still strong this year while housing is kicking in. The big difference is that there’s no election in the US down the road. There are elections scheduled this year in Europe and it depends how Germany goes about it. But they are more of a concern for Europe than in the US, he noted.

Read More