ETF/No Load Fund Tracker Newsletter For Friday, April 19, 2013
ETF/No Load Fund Tracker StatSheet
————————————————————-
THE LINK TO OUR CURRENT ETF/MUTUAL FUND STATSHEET IS:
https://theetfbully.com/2013/04/weekly-statsheet-for-the-etfno-load-fund-tracker-newsletter-updated-through-04182013/
————————————————————
Market Commentary
Friday, April 19, 2013
STOCK INDEXES GAIN, BUT IT REMAINS WORST WEEK OF 2013
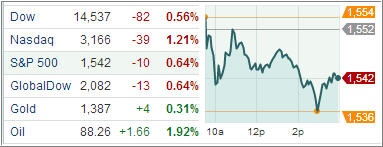
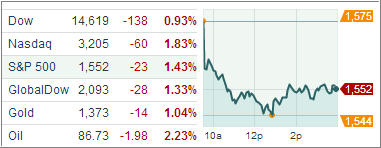
Stocks entered the weekend on a mixed note. The major averages were able to pare early session losses and close the trading day higher. However, the Dow Jones Industrial Average lagged behind other indices. It added 10 points (0.1%) to 14,548; the Nasdaq Composite ascended 40 points (1.3%) to 3,206; and the S&P 500 Index was up 14 points (0.9%) to 1,555, but the gains weren’t enough to stop the S&P 500 from suffering its worst week since November.
Friday’s trading volume was the lowest of the week but in line with the average for the year. Much of Boston, home to a number of the country’s biggest mutual fund companies, was under virtual lockdown as police mounted house-to-house searches for the Marathon’s bombing suspect.
With the market rebounding broadly, seven of 10 sectors ended with gains of at least 1.0%. Energy, technology, and industrials were the only three sectors which lagged. The energy space ended flat as crude oil added 0.2% to $88.20. Tech shares were pressured by IBM’s disappointing earnings, despite Google and Microsoft beating earnings. The industrial space was the third notable laggard as General Electric weighed. GE shares fell 3.7% in the afternoon, trading just above its 200-day moving average after falling below that line intraday, because revenue was down a bit from last year and profit just met forecast. GE saw significant pressure as conditions weakened further in Europe with industrial segment revenues in the region down 17%.
The equity markets posted solid weekly declines as the S&P 500 endured its worst week of the year. The economic data this week painted a mixed picture, with regional manufacturing reports out of New York and Philadelphia showing expansion slowed for April, consumer and wholesale inflation data remaining tame, and jobless claims advancing higher.
Moreover, leading indicators declined for the first time since August 2012. Housing starts topped the one million mark for the first time since 2008, while building permits fell unexpectedly. Industrial production rose more than expected. The Fed Beige Book showed favorable economic conditions, highlighted by strength in housing construction and automobile sales.
International headlines also had major impact on the markets, as China’s Q1 GDP growth slowed unexpectedly. German investors’ and analysts’ confidence dropped lower than expected and speculation ramped up that the nation’s credit rating may be in jeopardy of a downgrade.
Additionally, earnings season took some of the attention off of the macroeconomic environment. Financials saw pressure following Dow members such as Bank of America Corp’s, Morgan Stanley’s, Goldman Sachs’ lackluster performances. Meanwhile, tech results were mixed, as upbeat reports from Microsoft and Google were met with softer-than-forecasted earnings earlier in the week from Intel and IBM.
Next week will be interesting as more big-name companies announce earnings. The market is getting very volatile at these levels and further disappointments could stall today’s solid rebound.
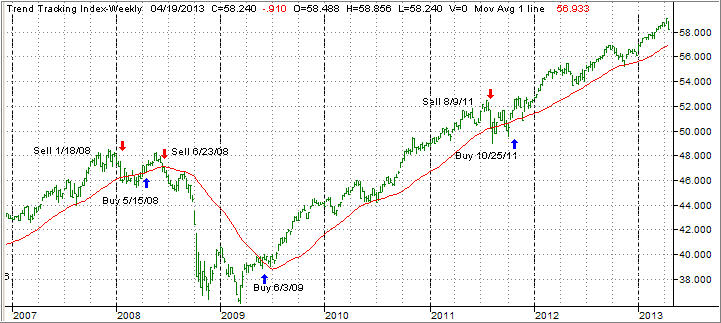
Our Trend Tracking Indexes (TTIs) slipped as downward momentum accelerated with all major indexes ending the week in red.
Here’s how we closed these volatile last five trading days:
Domestic TTI: +2.80% (last week +4.03%)
International TTI: +5.54% (last week +7.97%)
Have a great week.
Ulli…
————————————————————-
READER Q & A FOR THE WEEK
All Reader Q & A’s are listed at our web site!
Check it out at:
http://www.successful-investment.com/q&a.php
A note from reader Dan:
Q: Ulli: If I follow one of your ETF model portfolios, I understand that I use MY stop losses, which are pegged to the highest price of the individual ETF since I have owned it. That means that I may exit a particular ETF in one of your portfolios at a different time than your year-to-year chart shows.
What do I do once I have sold an individual ETF?
I no longer have the same holdings as you.
How would I know what to buy?
A: Dan: You are correct with your first paragraph…
Once you have sold, you can stay in cash, depending on market conditions, and re-purchase the same ETF once the old high, from which your sell stop was calculated, has been taken out again.
Or, you could purchase another fund/ETF depending on your risk tolerance. You can use my weekly StatSheet, which is published every Thursday, as a guide. The latest issue is posted here.
———————————————————-
WOULD YOU LIKE TO HAVE YOUR INVESTMENTS PROFESSIONALLY MANAGED?
Do you have the time to follow our investment plans yourself? If you are a busy professional who would like to have his portfolio managed using our methodology, please contact me directly or get more details at:
https://theetfbully.com/personal-investment-management/
———————————————————
Back issues of the ETF/No Load Fund Tracker are available on the web at:
https://theetfbully.com/newsletter-archives/

 To offset the downside risks of precious metals as prices come under increasing pressure, Credit Suisse has launched a silver exchanged traded note that aims to generate income through a covered call options strategy.