ETF/No Load Fund Tracker Newsletter For Friday, March 15, 2013
ETF/No Load Fund Tracker StatSheet
————————————————————-
THE LINK TO OUR CURRENT ETF/MUTUAL FUND STATSHEET IS:
https://theetfbully.com/2013/03/weekly-statsheet-for-the-etfno-load-fund-tracker-newsletter-updated-through-03142013/
————————————————————
Market Commentary
Friday, March 15, 2013
DOW RETREATS AFTER 10-DAY STREAK OF GAINS; EUROPE SLIPS
US stock indexes retreated, sending the Dow Industrials lower for the first time in 11 days and containing the S&P 500 just as it neared its record close following a surprise drop in a gauge of consumer confidence.
Data released today painted a mixed picture of the economy. Equities eased up after the University of Michigan-Thomson Reuters index of consumer confidence fell to an initial March reading of 71.8 from a final 77.6 reading in February, and raising worries about the impact of higher income tax rates on household spending.
Earlier in the day, the Labor Department said consumer price index rose 0.7 percent in February, driven higher by a spike in energy prices. Annual inflation rate came in at 2 percent, within the range the Federal Reserve feels comfortable in.
Separately, data released by the Federal Reserve showed industrial production rose 0.7 percent last month after being flat in January, and beating forecasts for a 0.4 percent growth.
Also, a gauge of manufacturing in the New York region expanded for a second month in March while industry managers grew optimistic about the future.
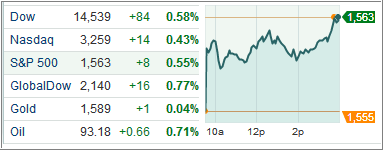
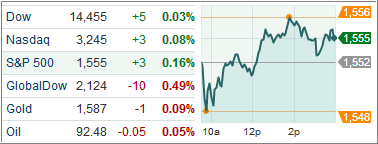
The Dow Jones Industrial Average (DJIA) shed 25 points to 14,514, snapping a 10-day winning run, its longest in more than 16 years and leaving the blue-chip index with a 0.8 percent weekly gain.
The S&P 500 Index (SPX) slid 3 points to 1,561, trimming its weekly gain to 0.6 percent. Telecommunications and consumer staples declined the most while utilities were the sole winner among its 10 business groups.
Treasury prices surged for the first time in three days, pushing 10-year yields below the 2 percent mark for the first time in six days as an unexpected drop in consumer confidence cast doubt over the strength of the economic recovery.
The US dollar dropped, easing to a one-week low against the euro after a report showed inflation was contained within the Fed’s stated target, giving the Federal Reserve reason to maintain its accommodative policies.
Meanwhile, European stocks traded lower Friday as US consumer confidence dipped in February (as eurozone finance ministers prepared to discuss a bailout package for Cyprus), but finished the week higher for a fourth time, the longest winning streak in almost three months.
Discussions about Cyprus could prove thorny as European politicians seem to be reluctant to back a bailout without significant concessions.
The Stoxx Europe 600 index slid 0.4 percent to close at 297, closing out the week 0.6 percent higher. The pan-European index has added 2.6 percent since the beginning of March.
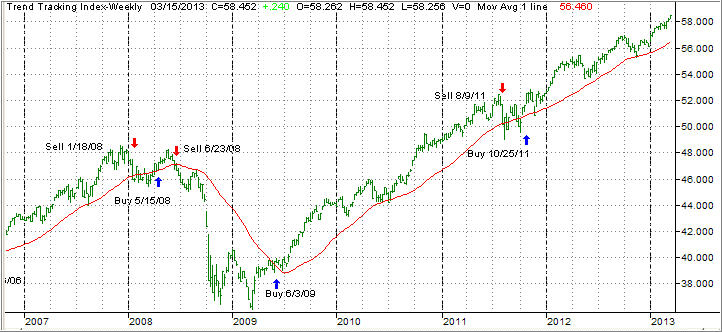
Our Trend Tracking Indexes (TTIs) moved higher over the past week and ended up as follows:
Domestic TTI: +3.51% (last week +3.29%)
International TTI: +10.50% (last week +10.24%)
That means, until proven otherwise, the bullish trend is alive and well, and we will follow it until our trailing sell stops give us the signal to exit.
Have a great week.
Ulli…
————————————————————-
READER Q & A FOR THE WEEK
All Reader Q & A’s are listed at our web site!
Check it out at:
http://www.successful-investment.com/q&a.php
A note from reader Steve:
Q: Ulli: Can you provide a basic explanation of your momentum (M-Index) without giving away your proprietary method?
A: Steve: All terms are described in the Glossary section, which is posted on the top of every StatSheet. In case you missed it, you can read it here:
http://www.successful-investment.com/GlossaryOfTerms.pdf
———————————————————-
WOULD YOU LIKE TO HAVE YOUR INVESTMENTS PROFESSIONALLY MANAGED?
Do you have the time to follow our investment plans yourself? If you are a busy professional who would like to have his portfolio managed using our methodology, please contact me directly or get more details at:
https://theetfbully.com/personal-investment-management/
———————————————————
Back issues of the ETF/No Load Fund Tracker are available on the web at:
https://theetfbully.com/newsletter-archives/

 Global X Funds, a New York-based provider of exchange-traded funds best known for its niche offerings, has launched the Global X SuperDividend US ETF (DIV). As the name suggests, the fund is a direct play on one prominent theme; the investors’ thirst for dividend and yield.