ETF/No Load Fund Tracker Newsletter For Friday, June 7, 2013
ETF/No Load Fund Tracker StatSheet
————————————————————-
THE LINK TO OUR CURRENT ETF/MUTUAL FUND STATSHEET IS:
https://theetfbully.com/2013/06/weekly-statsheet-for-the-etfno-load-fund-tracker-newsletter-updated-through-06062013/
————————————————————
Market Commentary
Friday, June 7, 2013
BULLS CHEER UNEMPLOYMENT REPORT
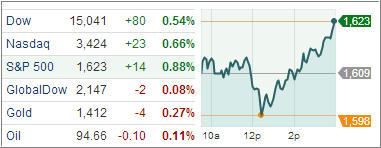
A wild week of trading came to an end with U.S. markets closing nicely higher as the Dow Jones Industrial Average scored its best day since January 2, and the Standard & Poor’s 500 Index ended a two-week losing streak with the best two-day rally since January.
The Dow closed 208 points higher (1.4%) at 15,248, the S&P 500 Index increased 21 points (1.3%) to 1,643, and the Nasdaq Composite ascended 45 points (1.3%) to 3,469. Stocks rallied after a mixed May employment report, which may suggest that the Federal Reserve will at least maintain its current pace of asset purchases until the lukewarm U.S. economy can show substantial signs of improvement.
Nonfarm payrolls increased by 175,000 in May, close to the consensus of 169,000. The unemployment rate, however, ticked up for the first time in four months on rounding to 7.6% from 7.5%, above expectations of 7.5%. The average workweek remained at an upwardly revised 34.5 hours. The labor force expanded by 420,000, with 319,000 more people counted as employed and 101,000 more unemployed. Those not in the labor force fell by 231,000, the biggest decline in seven months.
While the headline number surprised to the upside, the increase in the unemployment rate suggests the Federal Reserve will maintain its accommodative policy course in the immediate term. Cyclical sectors ended among the leaders as financials, industrials, and discretionary shares all gained more than 1.7%. Boeing, Walt Disney and American Express added more than 2.4 percent. The industrial sector stood out as transportation and defense companies rallied broadly. The discretionary sector added 1.8% as retailers provided a measure of support to the growth-oriented space. Many of today’s outperformers included recent laggards.
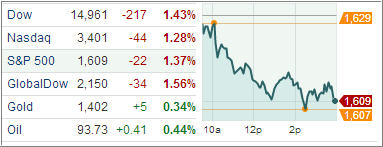
Through the wild swings of the market action this week, U.S. stocks finished modestly in the green as data suggested the economy remains soft enough to keep the Fed from expediting its exit plan. For the week, the Dow gained 0.9 percent, the S&P 500 rose 0.8 percent, and the Nasdaq added 0.4 percent.
The ISM Manufacturing Index unexpectedly depicted contraction and construction spending and factory orders rose at smaller rates than expected, offsetting a relatively upbeat Fed Beige Book report and a slightly stronger-than-expected ISM non-Manufacturing Index.
Meanwhile, Japan and Europe added to the volatility. Japanese markets falling sharply and briefly hitting bear market territory, as the yen continued to rally amid the nation’s disappointing long-term economic strategy. At the same time, the European Central Bank held off on providing additional stimulus measures while offering a mixed economic growth outlook.
Will volatility continue as traders and investors keep grappling over the Fed’s exit plan? Right now, it seems to be a tug-of-war between bulls and bears but I believe the stance of the Fed will eventually determine whether the next leg in the markets will be up or down.
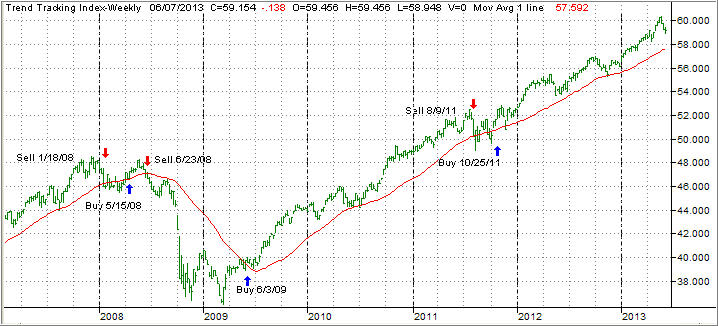
Our Trend Tracking Indexes (TTIs) went pretty much sideways and ended the week as follows:
Domestic TTI: +3.04% (last week +3.06%)
International TTI: +6.14% (last week +6.50%)
Have a great week.
Ulli…
————————————————————-
READER Q & A FOR THE WEEK
All Reader Q & A’s are listed at our web site!
Check it out at:
http://www.successful-investment.com/q&a.php
A note from reader Thomas:
Q: Ulli: Good morning. I need your opinion; I have a large share of my fixed income invested in HYG & JNK. Should I sell both positions at this time? Thank you.
A: Thomas: As you know, I let my trailing sell stops make those decisions for me, so that I don’t have to be emotionally involved. Depending on your risk tolerance, you can use a 5% or 7% trailing stop.
Figure out your high point from the time you purchased these ETFs, reduce that number by the dividends received, and then apply your sell stop. If it gets triggered, you sell; if not, you continue to hold. That’s what I would do.
———————————————————-
WOULD YOU LIKE TO HAVE YOUR INVESTMENTS PROFESSIONALLY MANAGED?
Do you have the time to follow our investment plans yourself? If you are a busy professional who would like to have his portfolio managed using our methodology, please contact me directly or get more details at:
https://theetfbully.com/personal-investment-management/
———————————————————
Back issues of the ETF/No Load Fund Tracker are available on the web at:
https://theetfbully.com/newsletter-archives/

 WisdomTree, the New York-based exchange-traded fund sponsor best known for its fundamental indexes, has further enhanced its offering of dividend focused ETFs with the recent launch of a dividend payout fund that tracks US companies showing good dividend growth prospects.