ETF/No Load Fund Tracker Newsletter For Friday, August 9, 2013

Ulli ETF Tracker Contact

ETF/No Load Fund Tracker StatSheet

————————————————————-

THE LINK TO OUR CURRENT ETF/MUTUAL FUND STATSHEET IS:

https://theetfbully.com/2013/08/weekly-statsheet-for-the-etf-newsletter-through-08082013/

————————————————————

Market Commentary

Friday, August 9, 2013

MARKETS TURN SOUTH FOR THE FOURTH TIME TO CLOSE THE WEEK

U.S. equity markets closed the day lower as domestic data remained light and the lingering Fed taper uncertainty hamstrung equities, despite some upbeat Chinese economic data. Investors pulled almost $1.20 billion from U.S. equity exchange-traded funds over the past four days, according to data compiled by Bloomberg from about 1,500 funds.

About $32 billion of deposits went into the funds in July, the most since September 2008, the data show. The Dow Jones Industrial Average closed 73 points lower (0.5%) at 15,426, the S&P 500 Index dropped 6 points (0.4%) to 1,691, and the Nasdaq Composite lost 9 points (0.2%) to 3,660.

Domestic economic data was limited to wholesale inventories which s fell 0.2% in June, contrary to expectations for a 0.5% gain. The decline was the third in row, resulting in 1.7% annualized drop in Q2. This suggests the inventory investment contribution to GDP would likely be revised lower, as wholesale inventories account for about 1/3 of total inventories. Shortly after opening in the red, the S&P index briefly turned positive, but just like yesterday, it was unable to make a sustained move above the 1,700 level.
Read More

Weekly StatSheet For The ETF Newsletter – Through 08/08/2013

Ulli ETF StatSheet Contact

ETF/Mutual Fund Data updated through Thursday, August 8, 2013

Table of Content082312

If you are not familiar with some of the terminology used, please see the Glossary of Terms.


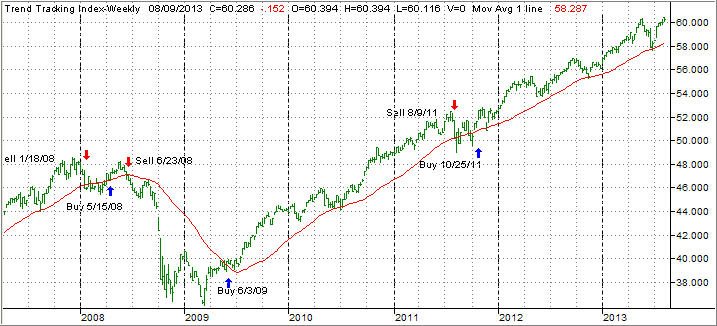
1. DOMESTIC EQUITY MUTUAL FUNDS/ETFs: BUY — since 10/25/2011

TTI

The Domestic TTI broke through its long-term trend line generating a Sell for this area effective 8/9/2011. Over the recent past, we’ve seen the TTI hovering slightly below and above this dividing line between bullish and bearish territory. The clear break to the upside occurred on 10/24/11 and, effective 10/25/11, a new Buy signal for domestic equities went into effect.

As of today, our Trend Tracking Index (TTI—green line in above chart) has bounced off its long term trend line (red) by +3.64% after briefly dipping below it late in June.

To avoid a potential whip-saw, a Sell signal to move out of all domestic equity positions will be generated once we have clearly pierced the line to the downside. Be sure to tune in for the latest updates.

Read More

Losing Streak Comes To A Halt Thanks To Data

Ulli Market Commentary Contact

Thur pic

[Chart courtesy of MarketWatch.com]

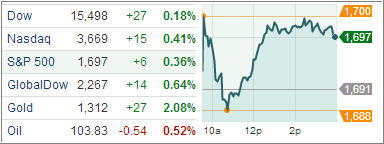
U.S. equity indexes rebounded from the morning lows to close higher for the first time this week, halting a three-day drop, aided by a stronger-than-expected export growth report out of China and a smaller-than-anticipated rise in domestic jobless claims. The markets were also fueled by some widely followed companies like Tesla and Groupon, which skyrocketed based on their quarterly reports.

The S&P 500 declined 1.1 percent the first three days of the week amid growing speculation the Federal Reserve will pare bond purchases this year as the economy strengthens. Data today showed claims for unemployment insurance edged up 5,000 last week to 333,000, near the consensus of 335,000. The four-week average of claims fell 6,250 to 335,500, the lowest level since November 2007, as labor market conditions continue to improve. The level is consistent with continued moderate payroll gains.

A separate report showed consumers last week were the most upbeat in more than five years. The Bloomberg Consumer Comfort Index rose to minus 23.5 for the period ended Aug. 4, its strongest reading since January 2008. Meanwhile, the Housing Affordability Index fell 10.9 points to 166.0 in June, its lowest level since July 2010. The decline was due to higher mortgage rates and median home prices, which overwhelmed a modest pickup in median family income.

Read More

Growing Speculation On Fed Cuts Keeps Bears Growling

Ulli Market Commentary Contact

Wed pic

[Chart courtesy of MarketWatch.com]

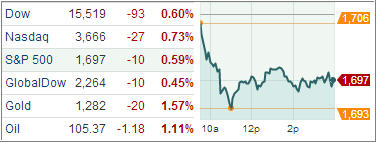
U.S. equities continued their red figures for a third consecutive session on Wednesday amid a mixed bag on the earnings front, while a sedentary economic calendar offered little help. Mortgage applications snapped a seven-week losing streak, while consumer credit expanded.

Growing uncertainty over when the Federal Reserve may start to wind down its stimulus played a part over last few trading sessions. Stocks sold off at the open after Asian indices endured a downbeat session with Japan’s Nikkei falling 4.0% as dollar/yen continued its recent weakness.

In earnings news, Dow member Walt Disney bested analysts’ expectations, but its studio entertainment unit underperformed. Moreover, Time Warner topped expectations and boosted its business outlook, and AOL beat estimates, while announcing an agreement to acquire Adap.tv and an increase to its share repurchase program.

Read More

7 ETF Model Portfolios You Can Use – Updated through 8/6/2013

Ulli Model ETF Portfolios Contact

After several attempts, the S&P 500 finally managed to pierce the glass ceiling represented by the 1,700 milestone marker. Not only did we close clearly above it (1,710), we remained there for three days until yesterday’s sell off took us back below that level.

With the earnings season winding down and talk of tapering due later on this year accelerating, we may have conquered the 1,700 level, but the challenge will be to stay there for any length of time as certainly new ammunition is needed to shoot the indexes higher.

Bond ETFs are still in bear market territory and, while some bounced off their June lows, the major trend is still down. I don’t see any opportunities in that arena until a new trend line break to the upside occurs.

Here’s the latest ETF Model Portfolio update:

Read More

Major Market Index ETFs Drop Again On Earnings And Fed’s Comments

Ulli Market Commentary Contact

Tue pic

[Chart courtesy of MarketWatch.com]

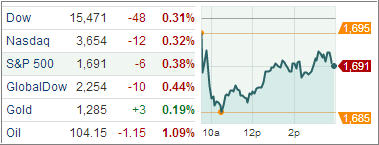
U.S. equity ETFs slid for a second consecutive day amid a plethora of mediocre earnings reports on both sides of the pond, despite the U.S. trade balance narrowing to its smallest deficit since October 2009. Adding to the negative atmosphere on the markets were comments from a pair of U.S. Federal Reserve officials fueling concern the Federal Reserve may reduce its bond purchases this year. All ten sectors of the S&P 500 Index registered losses.

Cyclical sectors pressured the index below the 1,700 level with financials, materials, and industrials leading to the downside. All top-weighted banks ended in the red while the broader sector slid 0.9%. Elsewhere, materials finished at the bottom of the leaderboard as steelmakers, gold miners, and chemical producers displayed broad weakness.

Most cyclical sectors trailed behind the broader market, but technology and discretionary shares outperformed slightly. In the discretionary space, media and publishing names displayed some strength after Washington Post agreed to sell its newspaper publishing business to Jeff Bezos. However, home builders and retailers lagged. Unlike growth-sensitive sectors, three of four countercyclical groups were able to erase a portion of their losses.

Read More