ETF/No Load Fund Tracker Newsletter For Friday, August 23, 2013
ETF/No Load Fund Tracker StatSheet
————————————————————-
THE LINK TO OUR CURRENT ETF/MUTUAL FUND STATSHEET IS:
————————————————————
Market Commentary
Friday, August 23, 2013
BULLS ADVANCE DESPITE HOUSING SALES SLUMP
Domestic equity markets were able to hold onto gains and close Friday’s trading session higher, as investors weighed how a sharp decline in U.S. new home sales may affect the Federal Reserve’s decision on when to scale back its stimulus efforts.
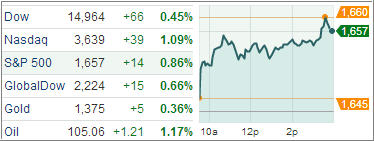
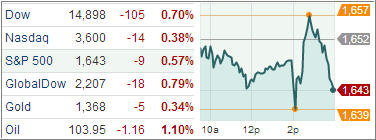
The Standard & Poor’s 500 Index posting its first two-day rally in three weeks, climbing 0.4 percent to 1,663.47. The Dow Jones Industrial Average rose 46.62 points, or 0.3 percent, to 15,010.36, and the Nasdaq Composite added 19 points (0.5%) to 3,658.
On the equity front, shares of Dow member Microsoft posted their largest daily percentage gain in more than four years after the company announced that its long time CEO Steve Ballmer will be retiring within the next 12 months. On the only big economics report of the day, new home sales slumped 13.4% in July to a 394,000 annual rate on top of large downward revisions to the prior three months totaling 69,000, a huge disappointment and breaking an uptrend line in the process.
It was the biggest one-month drop since May 2010. Economists were expecting a slight 1.4% decline to a 490,000 unit annual rate. Sales fell in all four regions. On a y/y basis, sales fell to 6.8%, the slowest growth since December 2011. Price increases have slowed as well, falling to the 10% to 12% range from a peak of 15% at the beginning of the year. Even so, new homes are quite expensive relative to income. Higher mortgage rates, higher prices, and low availability appear to be crimping sales. Home builders tumbled in reaction to the data.
This weighed on the discretionary sector, which ended with a razor-thin gain of 0.02%. Recent weeks have entertained much discussion over when the Federal Reserve will begin cutting back the pace of its asset purchases. While comments from many Fed speakers have suggested the first taper may occur as early as September, today’s new home sales report speaks against tapering in the immediate term. For the week, the S&P added 0.3%, Nasdaq rose 1.4%, and the Dow shed 0.6%.
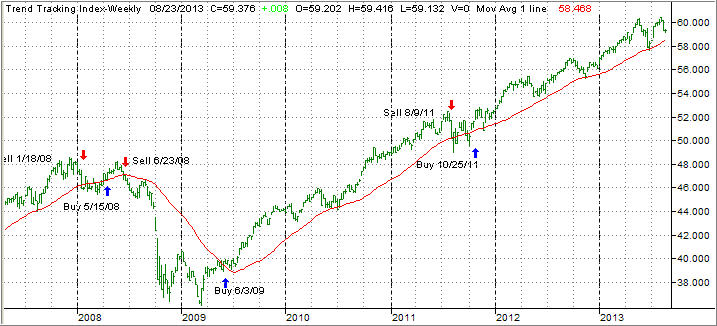
Our Trend Tracking Indexes (TTIs) recovered from last week’s drubbing and closed the past five trading days as follows:
Domestic TTI: +1.85% (last week +1.67%)
International TTI: +5.18% (last week +5.86%)
Have a great week.
Ulli…
————————————————————-
READER Q & A FOR THE WEEK
All Reader Q & A’s are listed at our web site!
Check it out at:
http://www.successful-investment.com/q&a.php
A note from reader Robert:
Q: Ulli: I am a US Government employee with my retirement funds in the governments Thrift Savings Plan. As I’m sure you know our plan enables us to invest in an international fund which tracks the EAFE.
With Europe beginning to get back on its feet, coupled with China, do you believe I would get more return with the international fund than investing in a fund which tracks the S&P 500.The international fund is lagging behind for the year so far but would it be a good bet going forward? Thanks for your attention…I faithfully read all of your market commentaries and look forward to next week.
A: Robert: You could go that route as long as you use my recommended sell stop discipline to protect or limit the downside risk.
While a couple of data points have indeed been positive, long-term, I think Europe will be a disaster.
Right now, appearances are everything as the German elections loom in September. There is nothing positive in any of the countries like Spain, Italy, Portugal and even France, which are basically insolvent.
I still think the U.S. is least dirty shirt in the basket, so my investment theme for this year has been domestic, and I don’t see any good argument to change that. Of course, all my thinking will change once the domestic trend line crosses into bear market territory.
———————————————————-
WOULD YOU LIKE TO HAVE YOUR INVESTMENTS PROFESSIONALLY MANAGED?
Do you have the time to follow our investment plans yourself? If you are a busy professional who would like to have his portfolio managed using our methodology, please contact me directly or get more details at:
https://theetfbully.com/personal-investment-management/
———————————————————
Back issues of the ETF/No Load Fund Tracker are available on the web at: