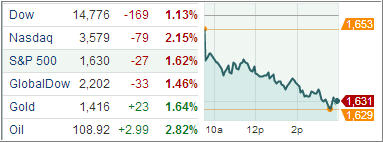
07-19-2013

Ulli Newsletter Archives Contact

ETF/No Load Fund Tracker Newsletter For Friday, July 19, 2013

ETF/No Load Fund Tracker StatSheet

————————————————————-

THE LINK TO OUR CURRENT ETF/MUTUAL FUND STATSHEET IS:

https://theetfbully.com/2013/07/weekly-statsheet-for-the-etfno-load-fund-tracker-newsletter-updated-through-07182013/

————————————————————

Market Commentary

Friday, July 19, 2013

TECH GIANTS DRAG STOCKS TO MIXED ENDING

On the heels of the Dow and S&P setting new highs yesterday, the U.S. equity markets experienced a lackluster trading session that wavered to a mixed finish today following weak earnings reports in the tech sector. The market also racked up a split decision for the week.

The Dow Jones Industrial Average closed 5 points lower at 15,544, the Standard & Poor’s 500 Index gained 3 points (0.2%) to 1,692, and the Nasdaq Composite lost 24 points (0.7%) to 3,588.

On a day without any major economic releases, corporations’ earning reports took the stage. Technology shares displayed weakness across the board, while the broader market was kept afloat by the outperformance of heavily-weighted energy, health care, and industrial sectors.

Today’s session featured disappointing earnings from technology heavyweights, Google and Microsoft. Microsoft led the slump in tech by plunging 11 percent, which was the most in more than four years after the company wrote off nearly $1 billion on its new tablet computer and reported declining revenue for its Windows operating system. Google dropped after its revenue fell below analysts’ forecasts, partly because the Internet search leader’s ad prices took an unexpected turn lower.

Meanwhile, Dow member General Electric posted stronger-than-forecasted earnings. The stock surged 4.6 percent to the highest in almost five years, pacing gains among industrial shares. Honeywell International and Chipotle Mexican Grill also reported earnings that beat the Street’s expectations.

The health care sector spent the entire session in a steady climb as biotechnology provided significant support. Energy sector advanced 1.4% on the back of better-than-expected earnings from Schlumberger. On a related note, crude oil added 0.3% to $108.15. Another commodity-related sector, materials, rose 0.5%. Gold futures displayed strength as well, climbing 0.8% to $1294.30 per troy ounce. How did the overall market perform this week?

Heading into the weekend, the S&P 500 and the Dow climbed 0.7% and 0.5%, respectively. Both rose for the fourth straight week while the Nasdaq slipped 0.3%. This week’s domestic economic calendar yielded some mixed reports.

Growth in manufacturing activity in the New York and Philadelphia regions unexpectedly accelerated for July, jobless claims fell more than expected, and homebuilder sentiment posted the strongest reading since January 2006. Meanwhile, June retail sales were softer than anticipated, housing starts and building permits both dropped, and Leading Indicators came in flat.

However, none of this mattered with the Dow and S&P 500 hitting all-time highs during the week, as 2Q earnings season continued to be relatively positive and economic sentiment was reiterated by Fed Chief Bernanke that given its employment and inflation outlooks, “a highly accommodative monetary policy will remain appropriate for the foreseeable future.”

Our Trend Tracking Indexes (TTIs) closed the week as follows:

Domestic TTI: +3.47% (last week +3.13%)

International TTI: +6.76% (last week +6.29%)

Have a great week.

Ulli…

————————————————————-

READER Q & A FOR THE WEEK

All Reader Q & A’s are listed at our web site!
Check it out at:

http://www.successful-investment.com/q&a.php

A note from reader Larry:

Q: Ulli: Your new E-Book is interesting, but I have one question based on your following statements:

A “Buy” signal for SPY is generated once the current price of SPY has crossed its 39-week SMA and has closed above it for 3 consecutive days. Once that has happened, our purchase will be executed on the 4th day at the closing price.

A “Sell” signal to close out the position will be generated once the current price closes below its 39-week SMA. Once that happens, we will sell the next day at the closing price.

I understand the 4th day to buy after the 39 week SMA has been crossed to the upside, but what about selling as it appears that you are instructing one to sell on the second day that the 39 week SMA is crossed to the downside, but what do you recommend if on the second day the market goes up strongly would you do a wait and see, please clarify the selling rules under that scenario.

A: Larry: Yes, you are absolutely correct. Before I execute any buy/sell order, I check market activity to be sure that a major reversal is not in the making. If it is, I hold off another day—that’s where active management comes in. For testing purposes in this research project, we did not make any management decisions but went straight for the execution.

———————————————————-

WOULD YOU LIKE TO HAVE YOUR INVESTMENTS PROFESSIONALLY MANAGED?

Do you have the time to follow our investment plans yourself? If you are a busy professional who would like to have his portfolio managed using our methodology, please contact me directly or get more details at:

https://theetfbully.com/personal-investment-management/

———————————————————

Back issues of the ETF/No Load Fund Tracker are available on the web at:

https://theetfbully.com/newsletter-archives/

ETF/No Load Fund Tracker Newsletter For Friday, July 19, 2013

Ulli ETF Tracker Contact

ETF/No Load Fund Tracker StatSheet

————————————————————-

THE LINK TO OUR CURRENT ETF/MUTUAL FUND STATSHEET IS:

https://theetfbully.com/2013/07/weekly-statsheet-for-the-etfno-load-fund-tracker-newsletter-updated-through-07182013/

————————————————————

Market Commentary

Friday, July 19, 2013

TECH GIANTS DRAG STOCKS TO MIXED ENDING

On the heels of the Dow and S&P setting new highs yesterday, the U.S. equity markets experienced a lackluster trading session that wavered to a mixed finish today following weak earnings reports in the tech sector. The market also racked up a split decision for the week.

The Dow Jones Industrial Average closed 5 points lower at 15,544, the Standard & Poor’s 500 Index gained 3 points (0.2%) to 1,692, and the Nasdaq Composite lost 24 points (0.7%) to 3,588.

On a day without any major economic releases, corporations’ earning reports took the stage. Technology shares displayed weakness across the board, while the broader market was kept afloat by the outperformance of heavily-weighted energy, health care, and industrial sectors.

Today’s session featured disappointing earnings from technology heavyweights, Google and Microsoft. Microsoft led the slump in tech by plunging 11 percent, which was the most in more than four years after the company wrote off nearly $1 billion on its new tablet computer and reported declining revenue for its Windows operating system. Google dropped after its revenue fell below analysts’ forecasts, partly because the Internet search leader’s ad prices took an unexpected turn lower.

Meanwhile, Dow member General Electric posted stronger-than-forecasted earnings. The stock surged 4.6 percent to the highest in almost five years, pacing gains among industrial shares. Honeywell International and Chipotle Mexican Grill also reported earnings that beat the Street’s expectations.

The health care sector spent the entire session in a steady climb as biotechnology provided significant support. Energy sector advanced 1.4% on the back of better-than-expected earnings from Schlumberger. On a related note, crude oil added 0.3% to $108.15. Another commodity-related sector, materials, rose 0.5%. Gold futures displayed strength as well, climbing 0.8% to $1294.30 per troy ounce. How did the overall market perform this week?

Read More

Weekly StatSheet For The ETF/No Load Fund Tracker Newsletter – Updated Through 07/18/2013

Ulli ETF StatSheet Contact

ETF/Mutual Fund Data updated through Thursday, July 18, 2013

Table of Content082312

If you are not familiar with some of the terminology used, please see the Glossary of Terms.


1. DOMESTIC EQUITY MUTUAL FUNDS/ETFs: BUY — since 10/25/2011

TTI

The Domestic TTI broke through its long-term trend line generating a Sell for this area effective 8/9/2011. Over the recent past, we’ve seen the TTI hovering slightly below and above this dividing line between bullish and bearish territory. The clear break to the upside occurred on 10/24/11 and, effective 10/25/11, a new Buy signal for domestic equities went into effect.

As of today, our Trend Tracking Index (TTI—green line in above chart) has bounced off its long term trend line (red) by +3.41% after briefly dipping below it late in June.

To avoid a potential whip-saw, a Sell signal to move out of all domestic equity positions will be generated once we have clearly pierced the line to the downside. Be sure to tune in for the latest updates.

Read More

Major Index ETFs Advance To New Records On Upbeat Economy

Ulli Market Commentary Contact

Thur pic

[Chart courtesy of MarketWatch.com]

U.S. equity index ETFs closed higher today thanks to mostly upbeat economic data, stronger-than-expected reported earnings from IBM, UnitedHealth Group, and Morgan Stanley, along with Fed Chairman Bernanke’s comments further reassuring markets.

The Dow Jones Industrial Average and the Standard & Poor’s 500 Index closed at record highs; with the S&P 500 notching a fresh intraday record of 1693.13. Meanwhile, the tech-heavy Nasdaq underperformed, ending unchanged. In light volume, more than 6 billion shares traded hands on U.S. exchanges today, or 5.4 percent below the three-month average. Today’s economic calendar was packed with many important releases.

Stocks advanced at the open and received an additional boost after the July Philadelphia Fed general business activity index rose 7.3 points in July to 19.8, the highest level since March 2011, as manufacturing activity in the region strengthened. Economists expected a reading of 7.7. Most individual indexes pointed to expansion. Notably, the employment index rose 13.1 points, the most since December 2003, to 7.7.

Read More

Bernanke’s Reassurance On Stimulus Lifts Stocks

Ulli Market Commentary Contact

Wed pic

[Chart courtesy of MarketWatch.com]

The major U.S. equity ETFs finished trading with modest gains after a choppy session, amid the Federal Reserve Chairman Bernanke reiterating in Congressional testimony, that the Central Bank’s asset purchases could be increased or reduced depending on the health of the economic recovery.

Supporting the up-down session were an unanticipated declines in domestic building permits and housing starts, the release of the Fed’s Beige Book that revealed the US economy maintained a “modest to moderate pace” of growth, while mortgage applications declined for the fifth-straight week.

Stocks opened the session in positive territory after Fed Chairman Ben Bernanke delivered his two-day semi-annual congressional testimony in front of the House Financial Services Committee. Bernanke noted that the economy continues to recover at a moderate pace, noting a significant contribution from housing, while acknowledging a gradual improvement in the labor market. However, the jobs situation is “far from satisfactory.”

Read More

7 ETF Model Portfolios You Can Use – Updated through 7/16/2013

Ulli Model ETF Portfolios Contact

Risk-on was the mode of the past five trading days as the S&P 500 added another 1.45% during this latest run into record territory.

Of course, as I have posted relentlessly, economic fundamentals have nothing to do with this current lift-a-thon, but it had everything to do with what the Fed said and didn’t say in regards to the potential tapering of its QE efforts.

Such is the world we’re living in and the only reality to me are the major trends; either up, down or sideways. As you know, we recently got stopped out of some of our model ETF portfolio holdings, but this was the week where a reversal occurred, at least in some of our former positions, which were now added back in as they broke their long-term trend lines to the upside.

How long that will last is everyone’s guess, but much of the future direction may depend on the interpretation of Bernanke’s semi-annual testimony on Capitol Hill later on today.

Here’s the latest ETF Model Portfolio update:

Read More