
- Moving the market
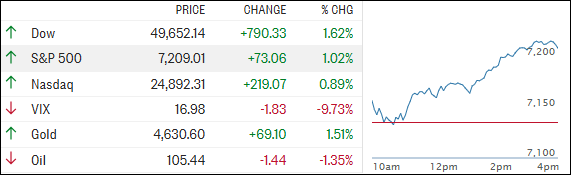
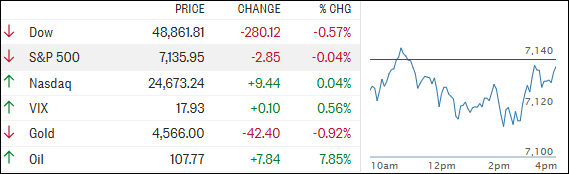
The major indexes were mostly flat early on, but the Russell 2000 stole the spotlight, hitting a new all‑time intraday high.
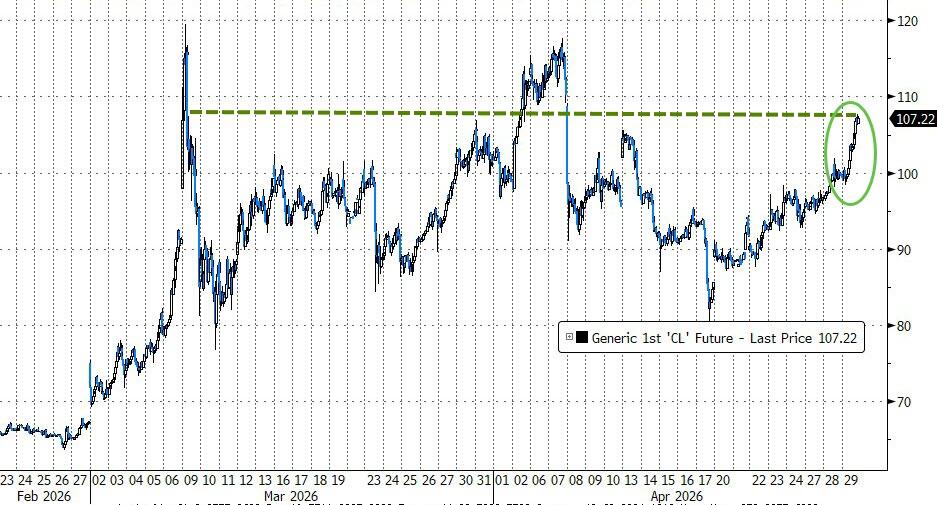
Meanwhile, fresh developments out of the Middle East pushed oil prices higher and reignited concerns about broader regional instability.
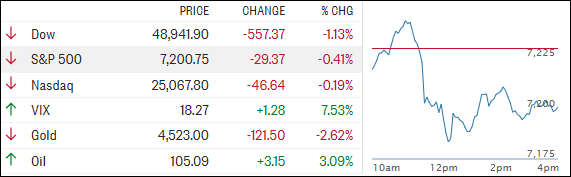
The Dow took a hit as the session unfolded, though it managed to bounce well off its lows amid conflicting reports of Iranian activity.
Iranian media claimed a ship was turned back from the Strait of Hormuz, while other reports suggested a possible attack on a U.S. warship—though none of the claims were independently confirmed.
According to Iranian state television, the country’s navy said it blocked what it called “American‑Zionist” warships from entering the area.
Separately, the Fars news agency reported that two missiles struck a U.S. vessel near Jask Island after warnings were ignored. Again, those reports remain unverified, adding to the fog surrounding the situation.
Over the weekend, President Trump announced “Project Freedom” in a Truth Social post, outlining plans for the U.S. to help escort and free cargo ships from non‑involved nations that have been stranded by the closure of the Strait of Hormuz.
The initiative is expected to kick off today.
Despite all the jawboning, markets have largely stayed resilient. Hope that tensions won’t spiral further, combined with a strong first‑quarter earnings season, has helped push stocks to record levels in recent days.
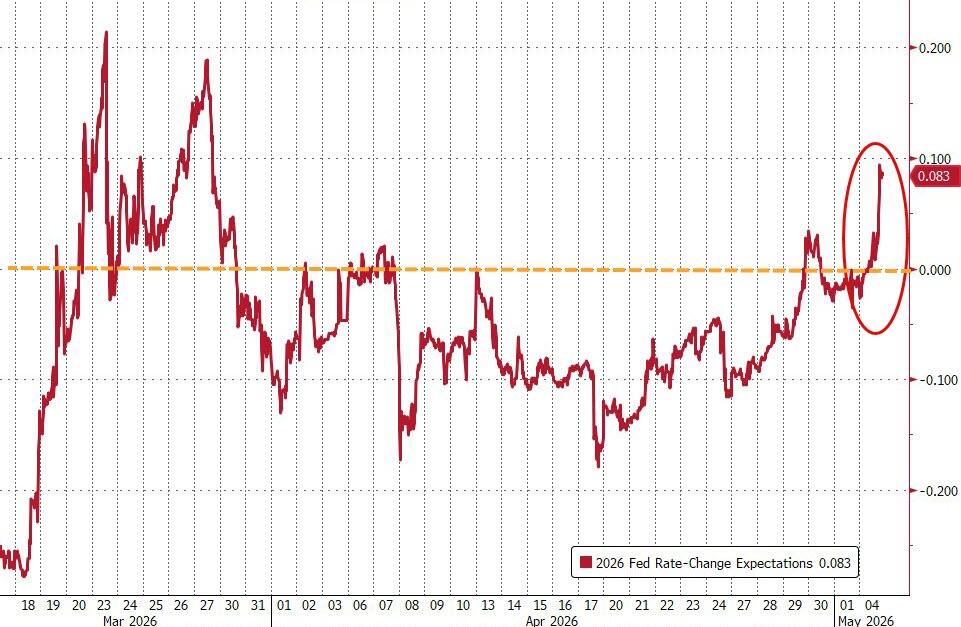
That optimism didn’t last all day, though. Mid‑session headlines of renewed Iranian attacks against the UAE sent oil prices and rate‑hike expectations higher, pulling the major indexes into the red by the close, with the Dow taking the biggest hit.
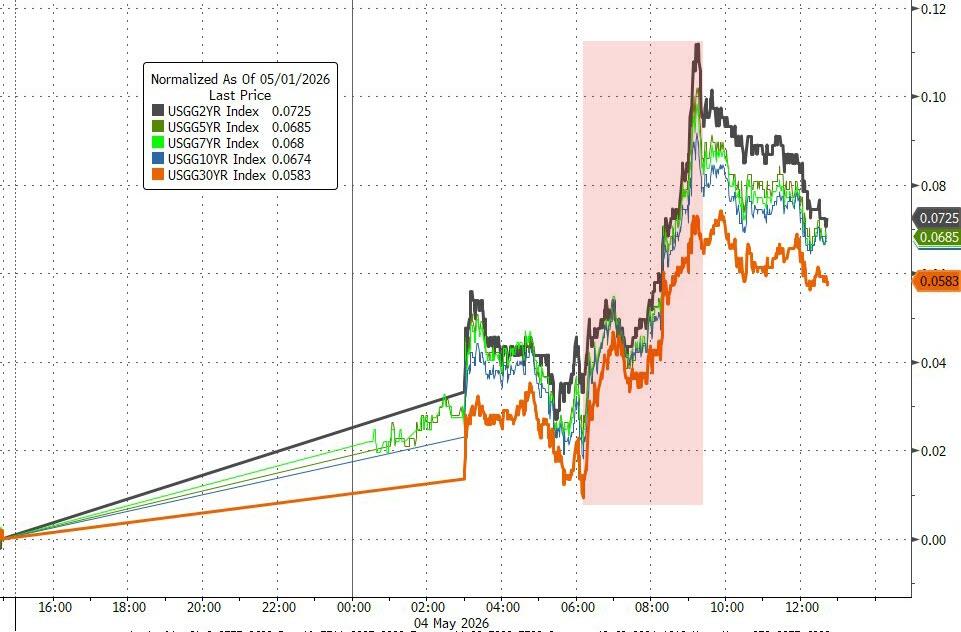
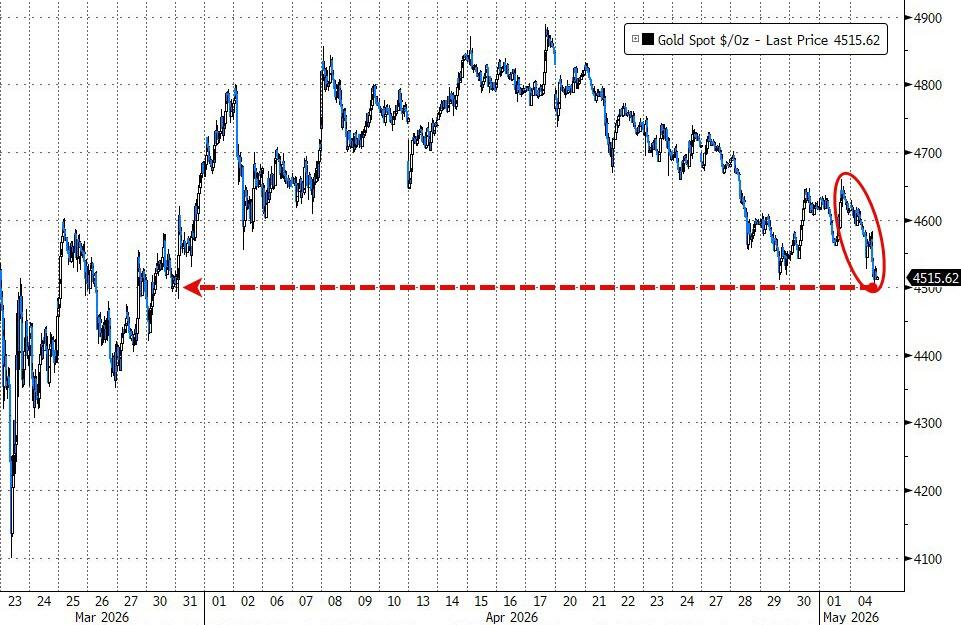
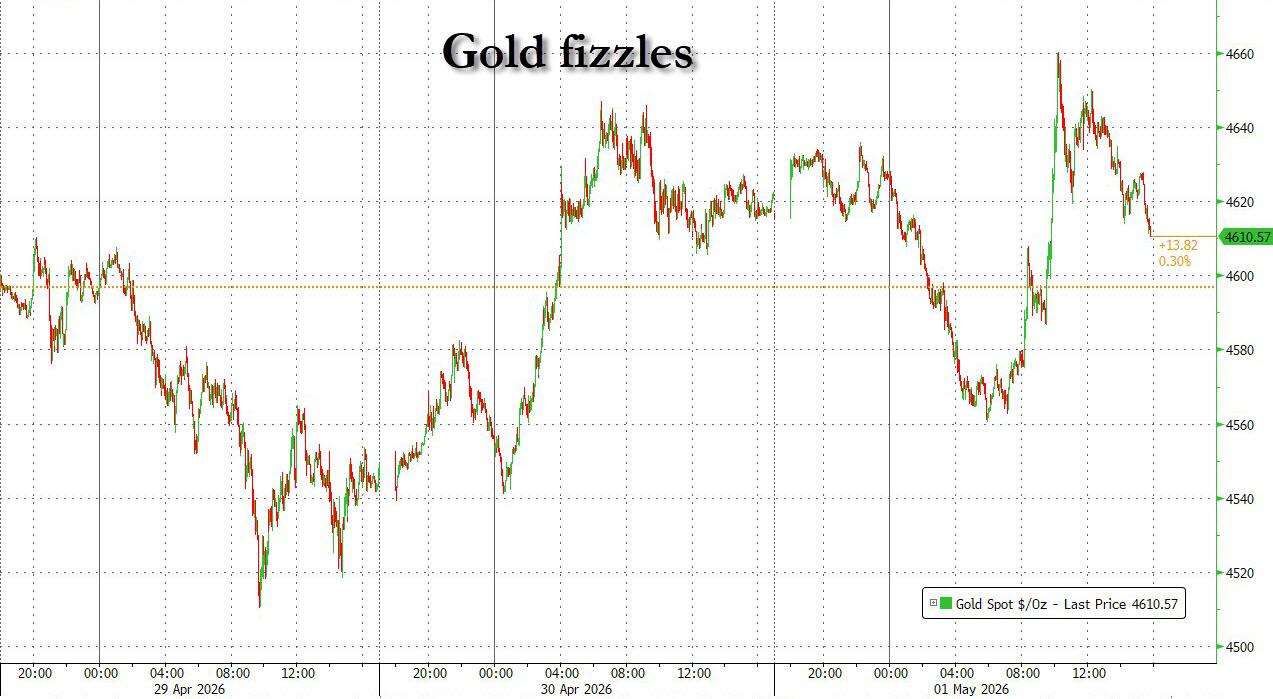
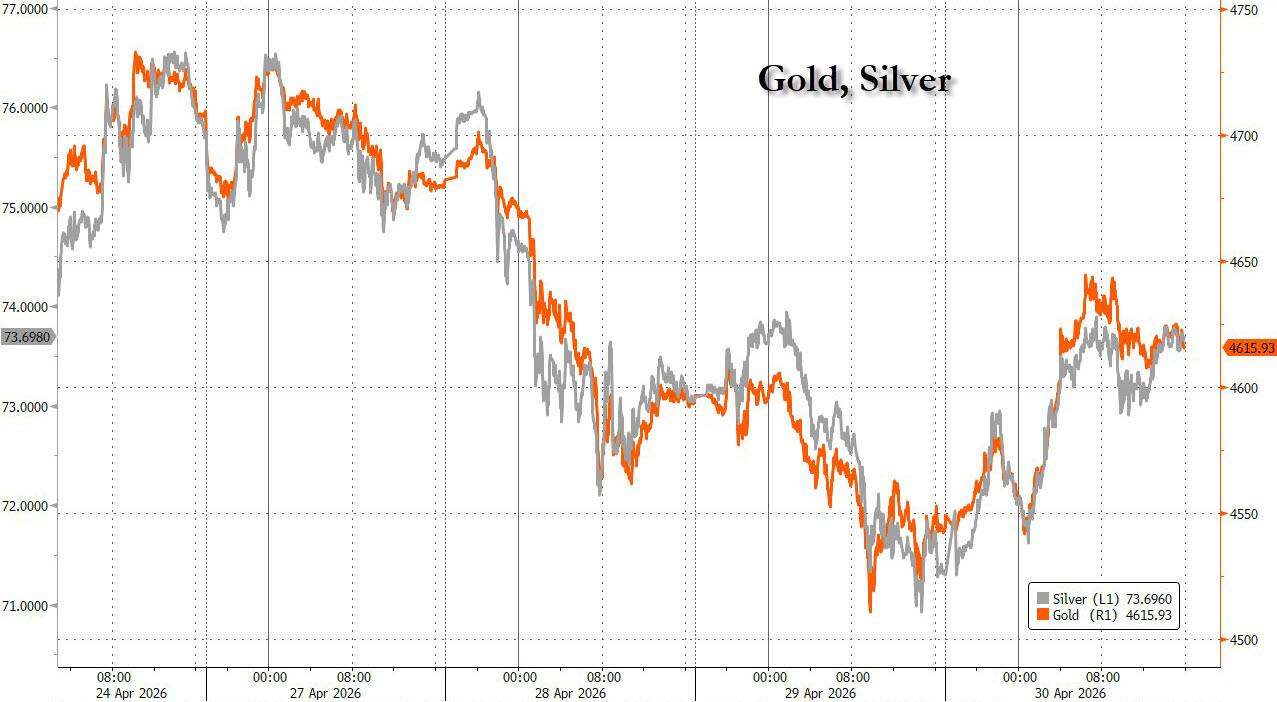
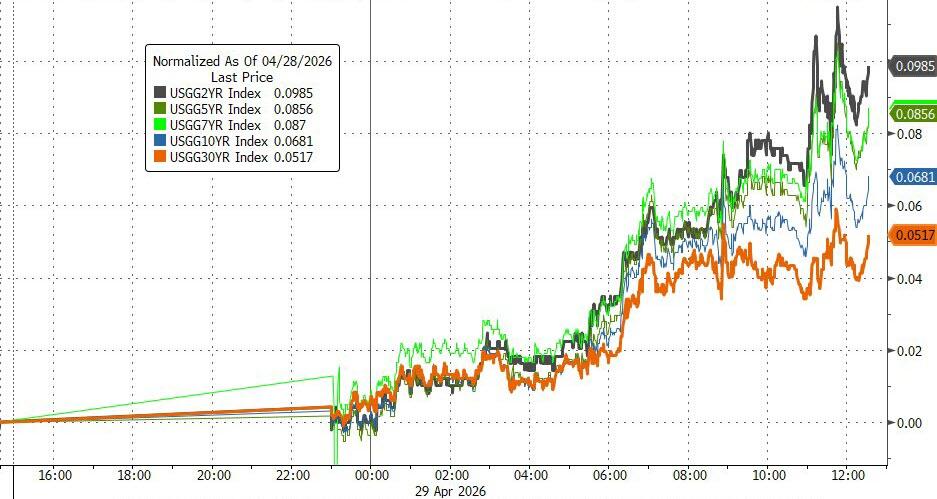
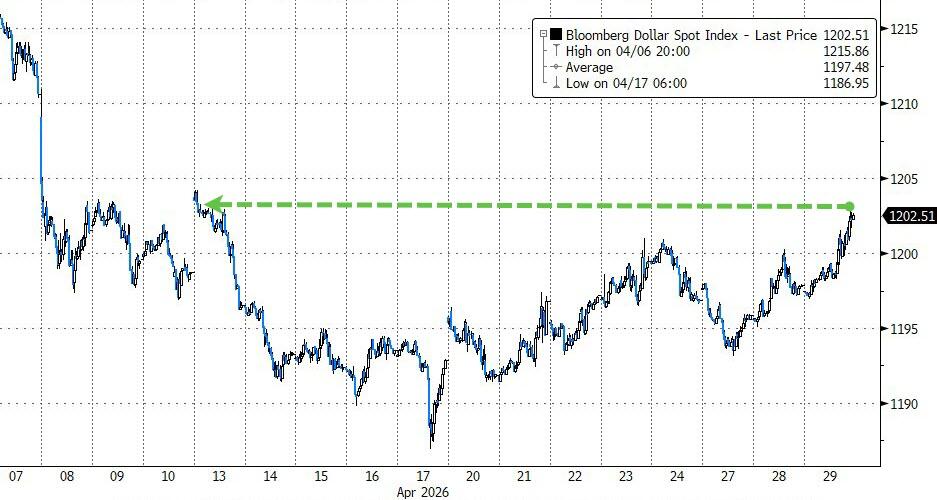
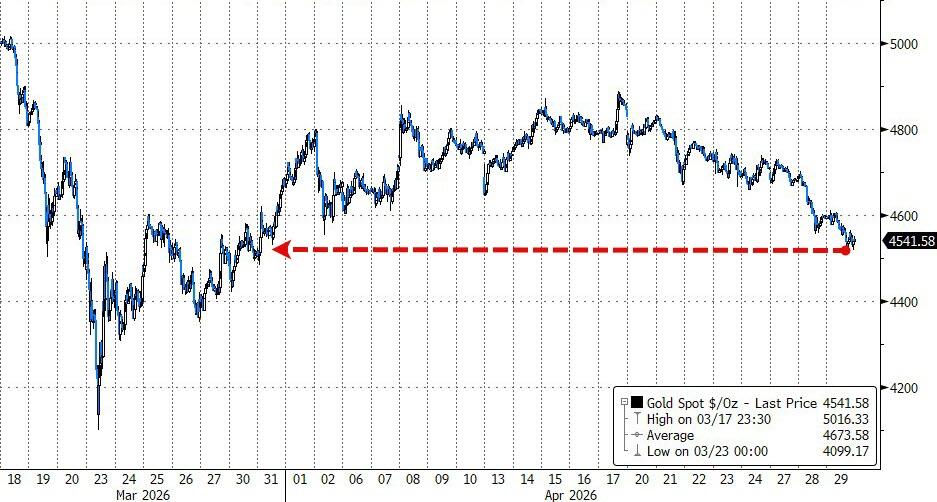
Bond yields surged, the dollar edged higher, and gold slid back to around $4,500—once again behaving as it tends to when rising oil prices bring inflation concerns to the forefront.
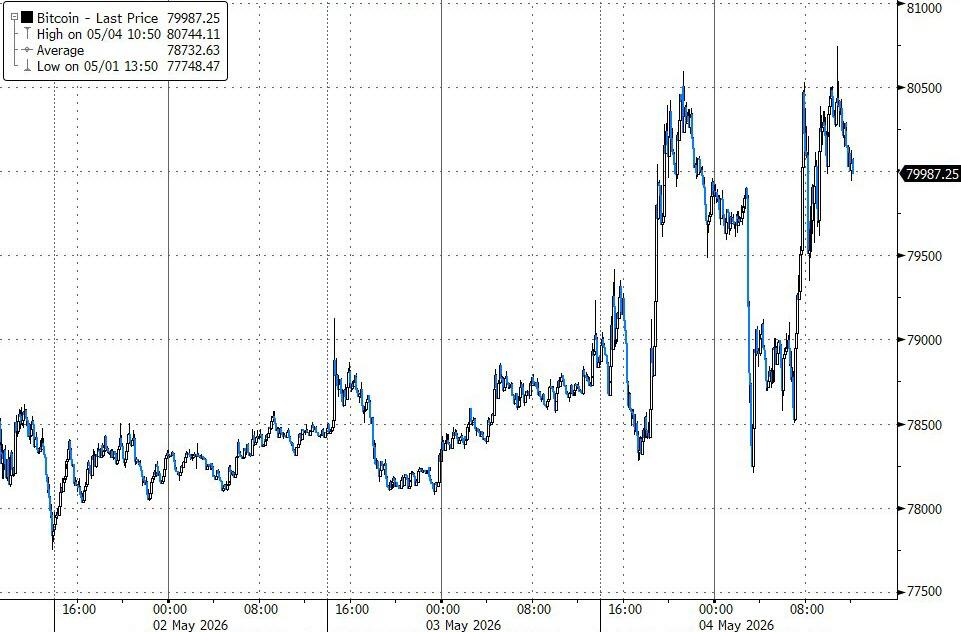
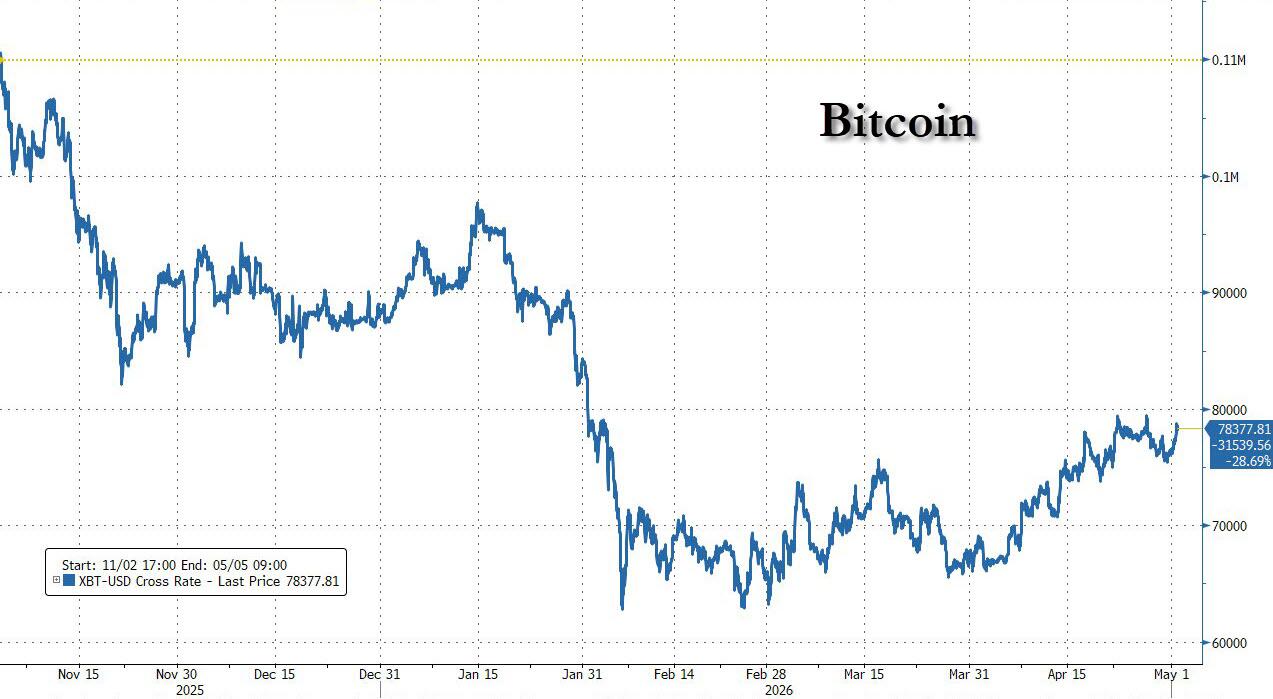
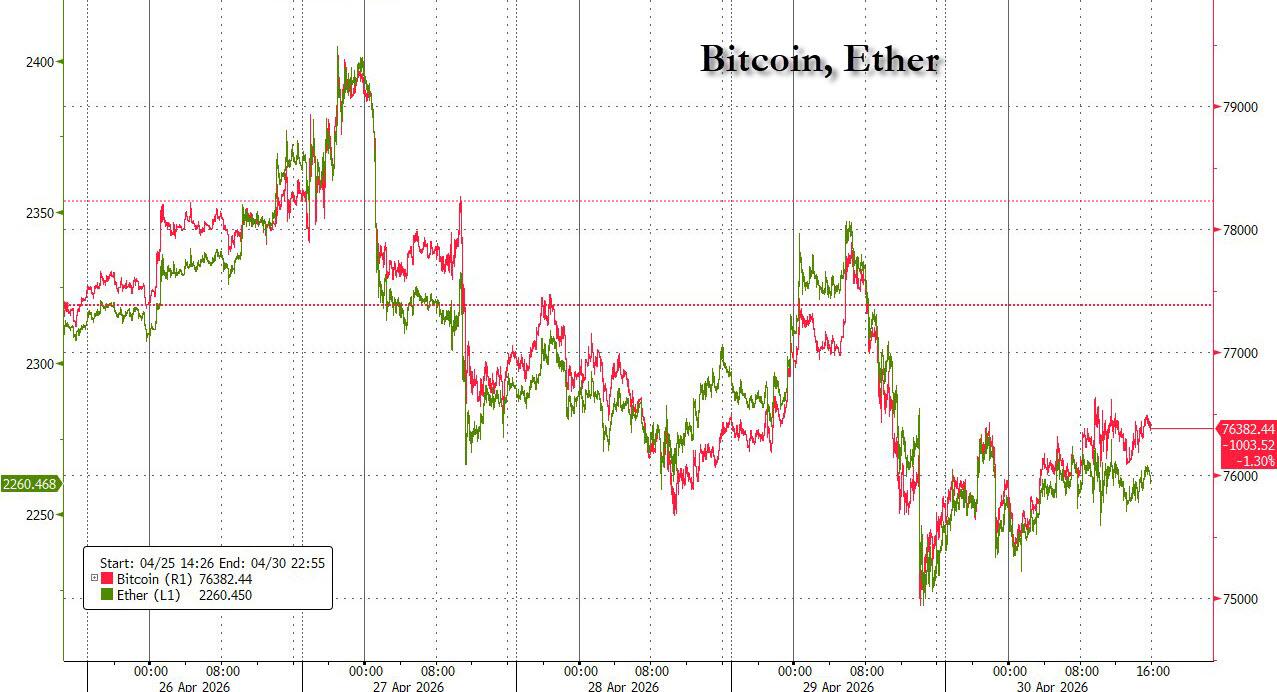
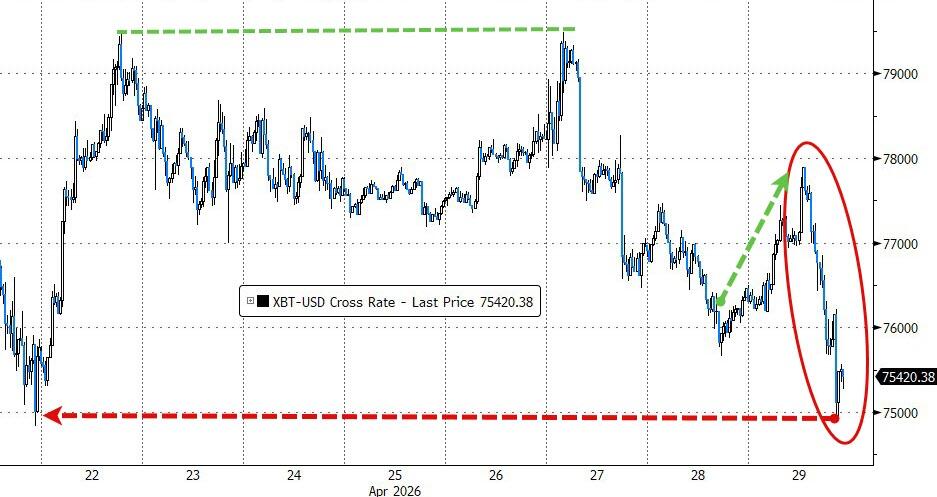
Bitcoin had a wild ride, swinging between $78,500 and $80,500 multiple times before finishing up about 2% and marking its highest level since January.
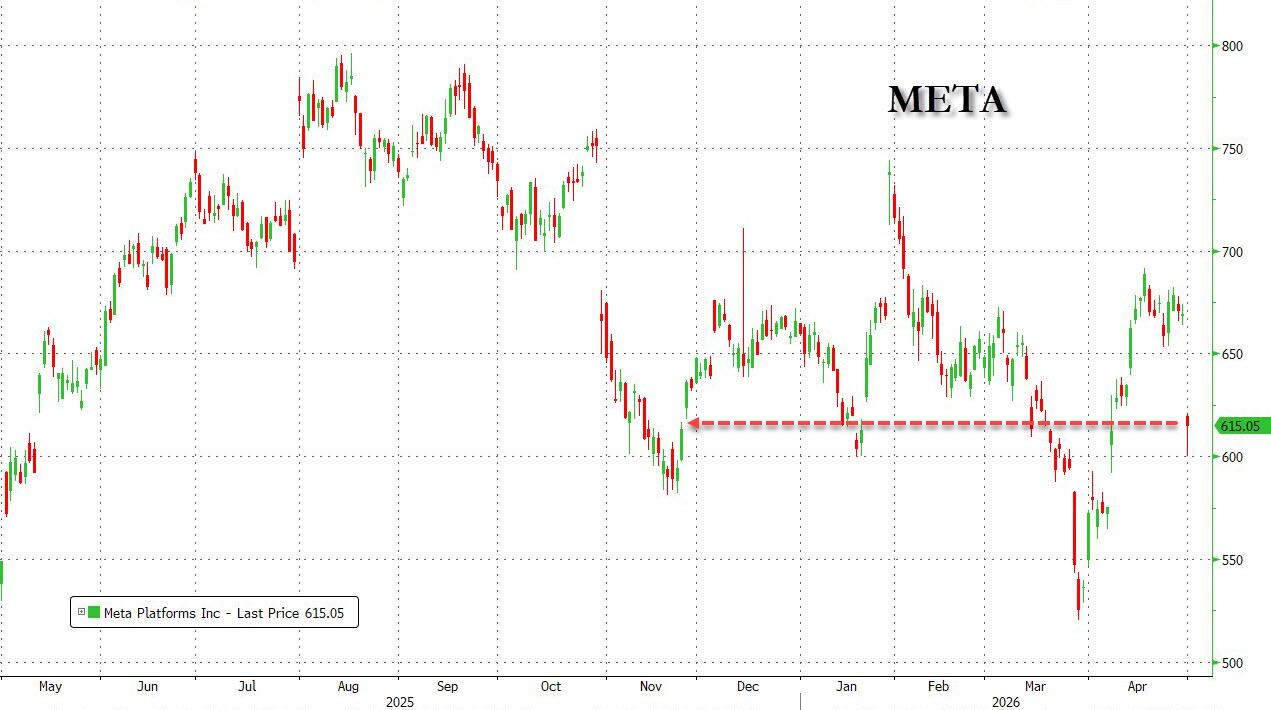
Even with all that volatility, earnings season continues to impress, with far more companies beating expectations than missing them.
The question now is: How long can strong earnings offset rising geopolitical and inflation risks?
Read More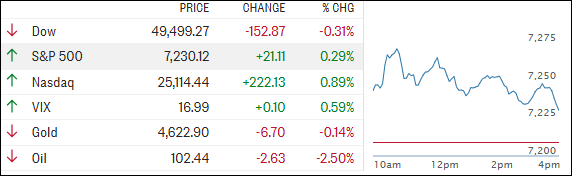
