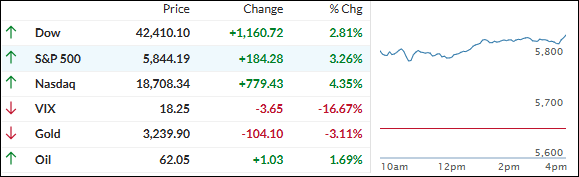
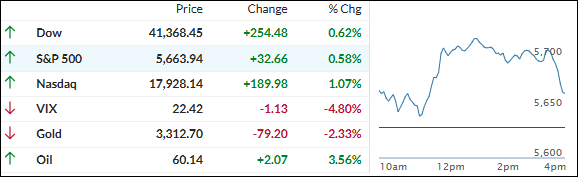
Equities surged at the opening following news that the U.S. and China agreed to temporarily slash tariffs after weekend negotiations in Switzerland.
Treasury Secretary Bessent described the talks as “very productive,” with both parties agreeing to cut reciprocal tariffs by 115% for nine days. Specifically, this means the U.S. will reduce Chinese tariffs to 30%, while China will lower tariffs on U.S. imports to 10%.
Bessent expects to meet again with the Chinese representative in the coming weeks to finalize a more comprehensive agreement.
Traders breathed a sigh of relief, and the markets responded with exuberance, pushing the S&P 500 back above its 200-day moving average (DMA) and slightly into positive territory for the year. Despite some uncertainty being alleviated, market volatility may persist until a final trade agreement is reached.
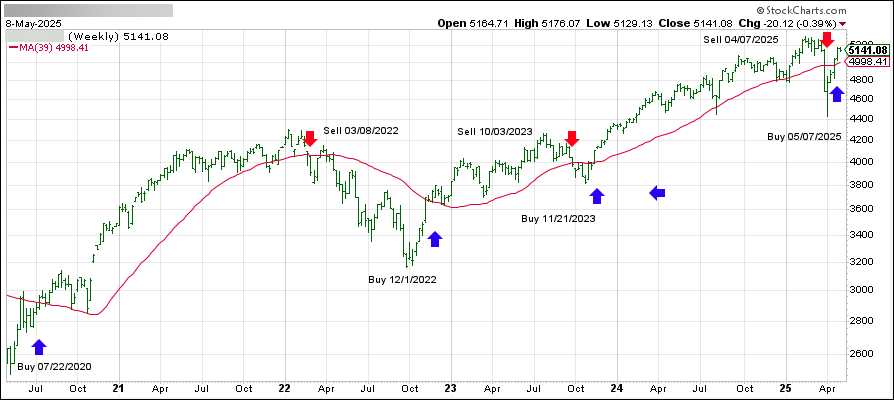
Today’s massive rally also pushed our domestic Trend Tracking Indicator (TTI) back above its trend line, though this is just the first attempt, and the sustainability of this move remains to be seen.
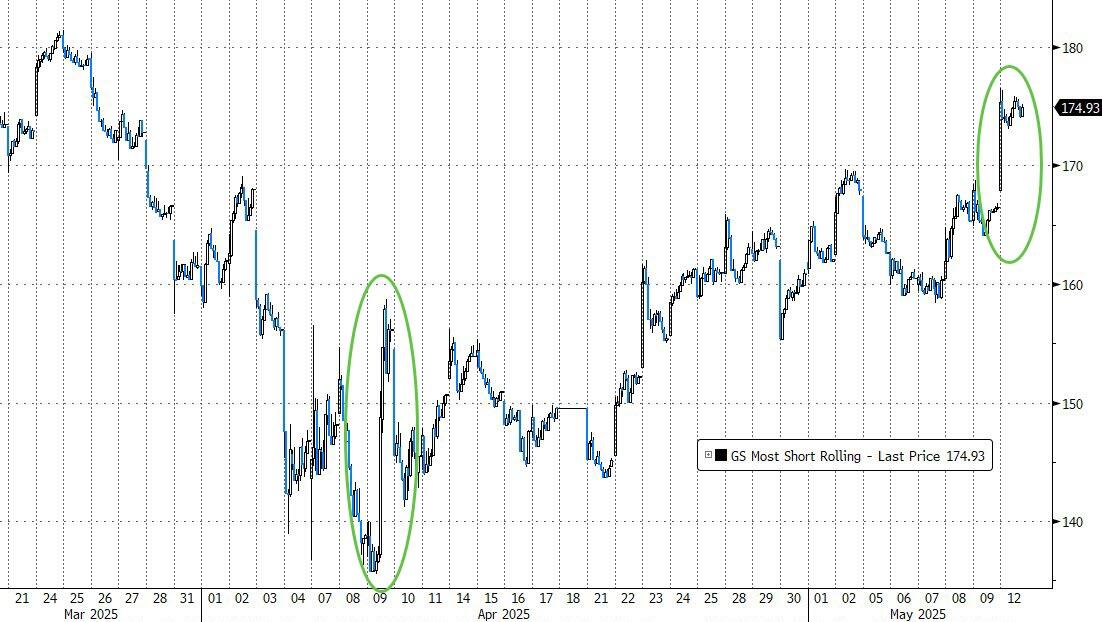
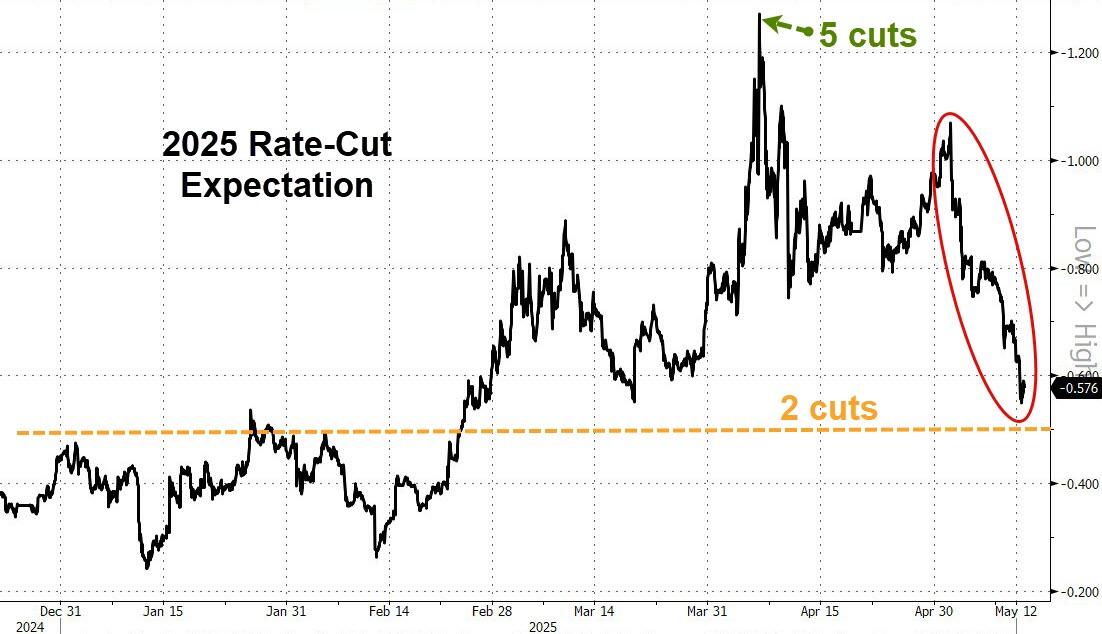
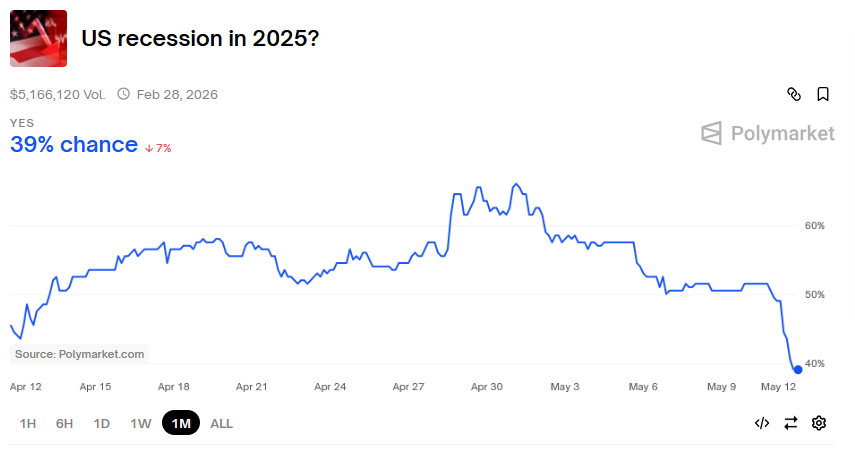
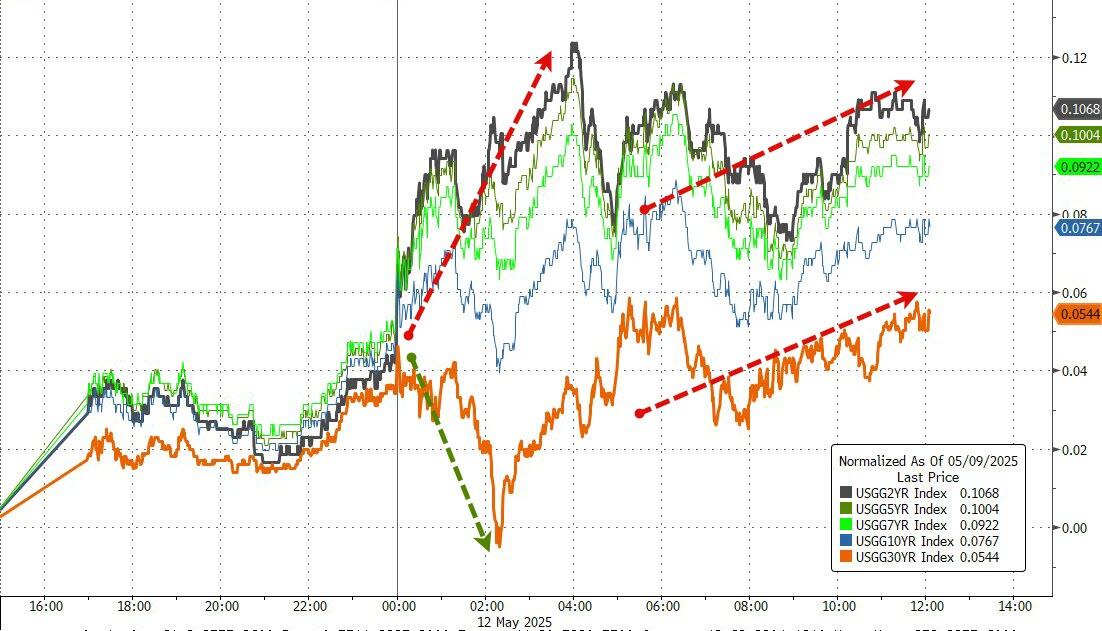
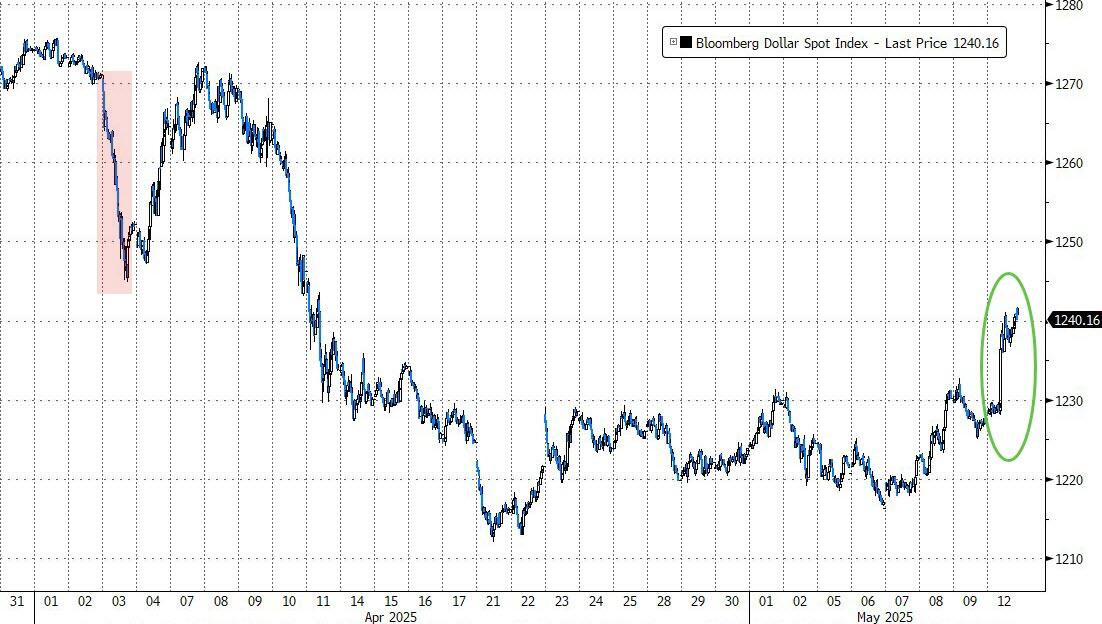
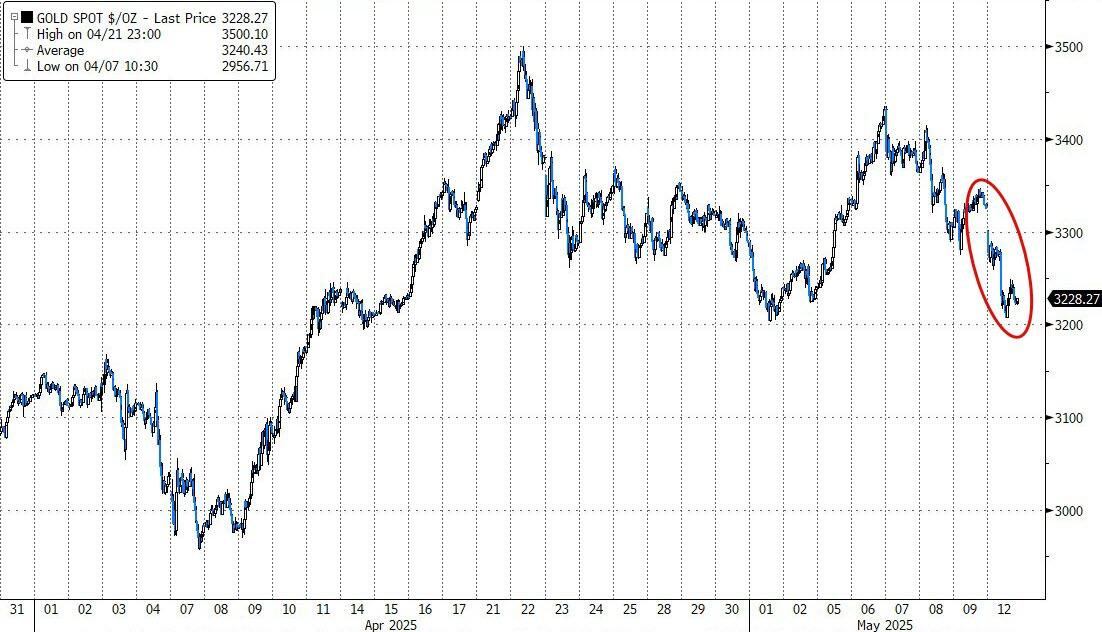
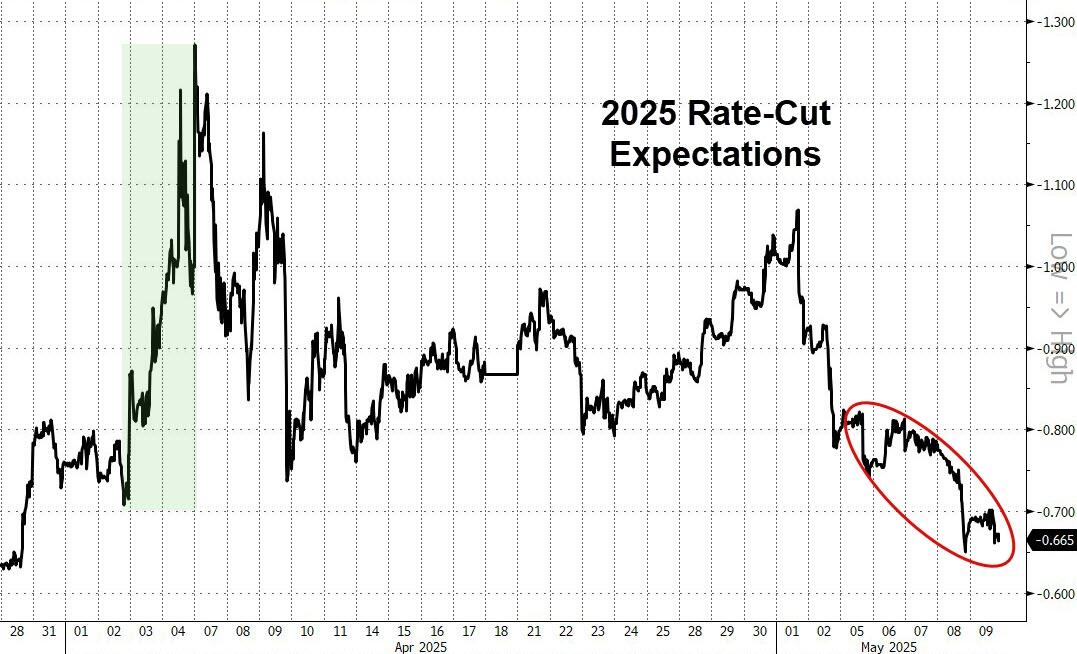
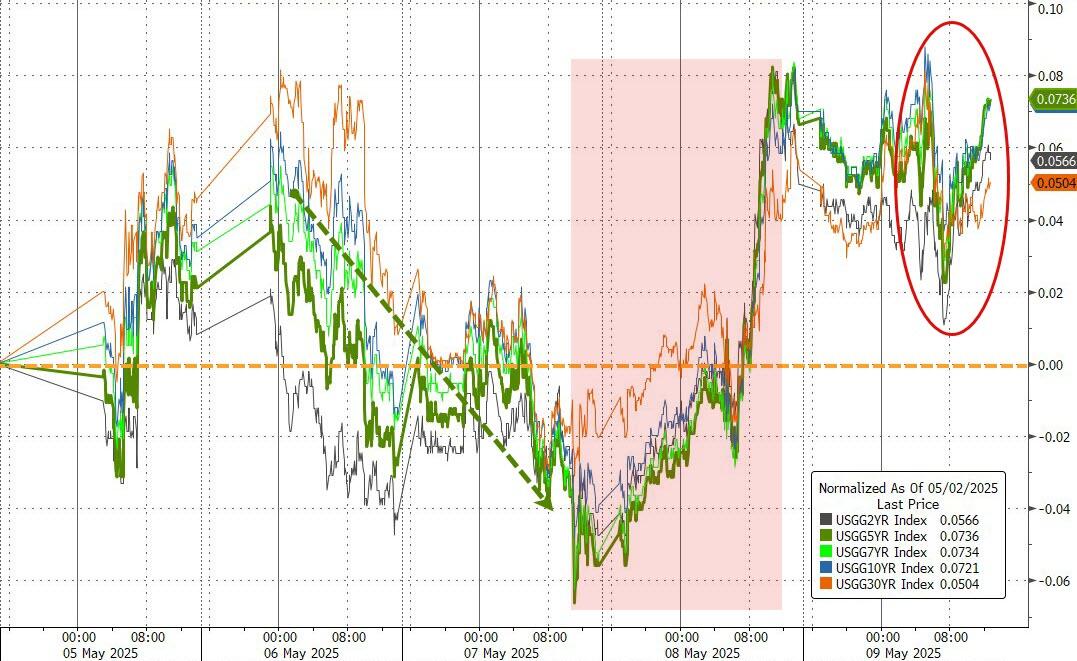
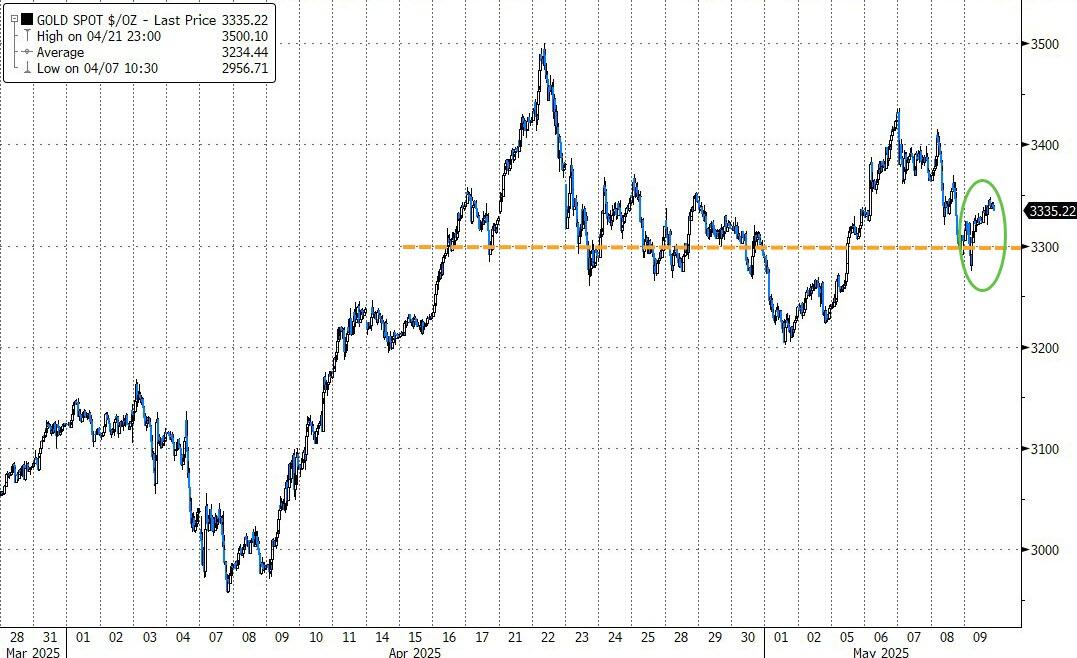
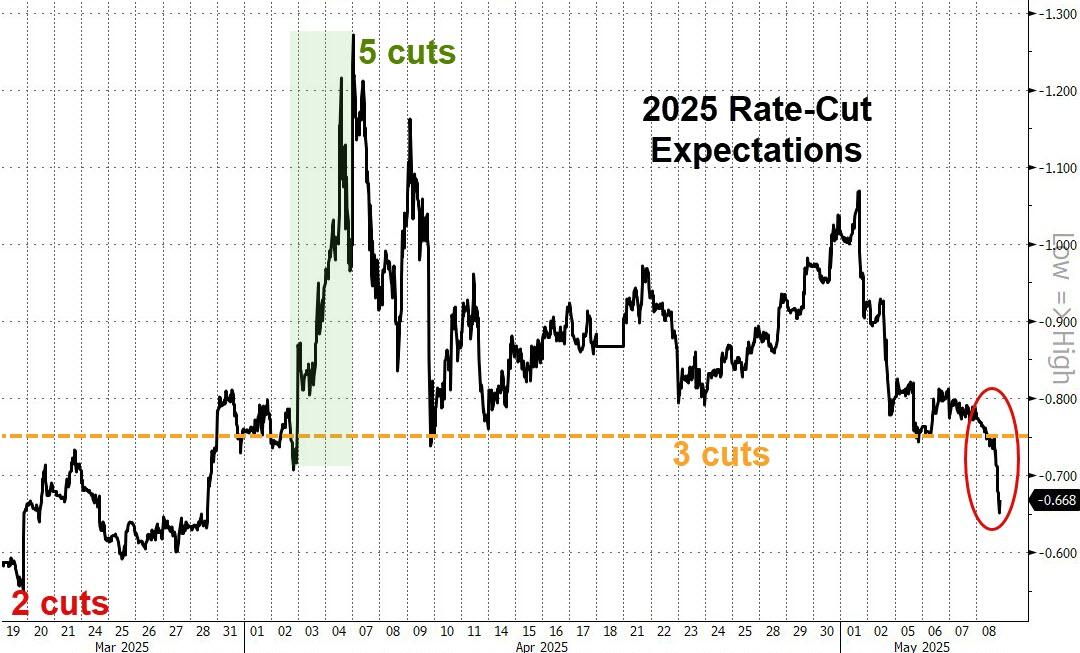
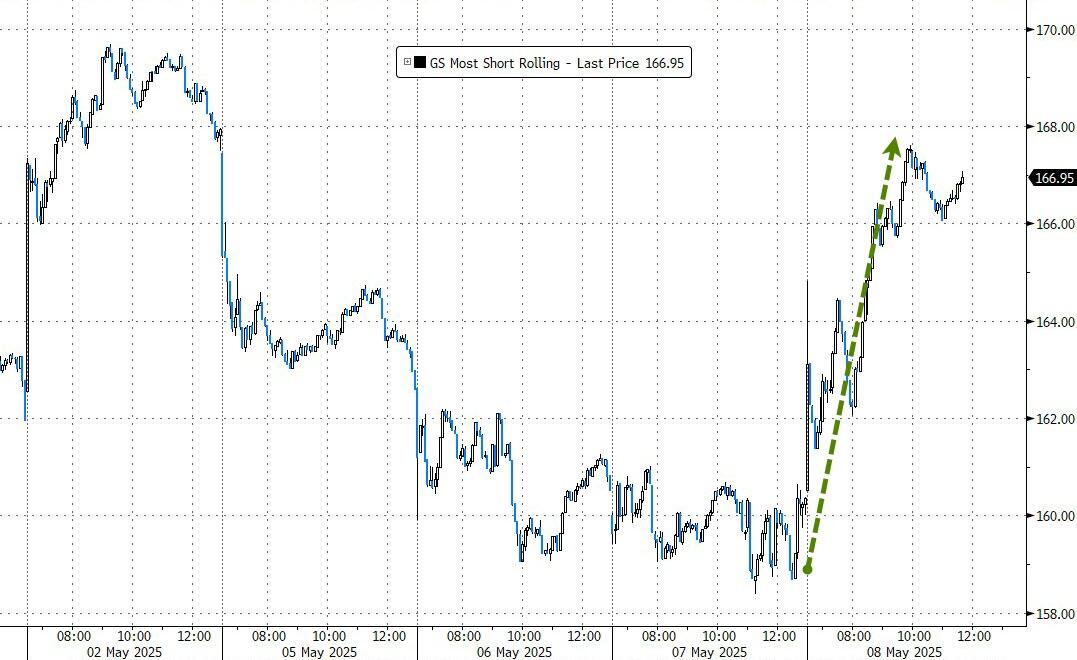
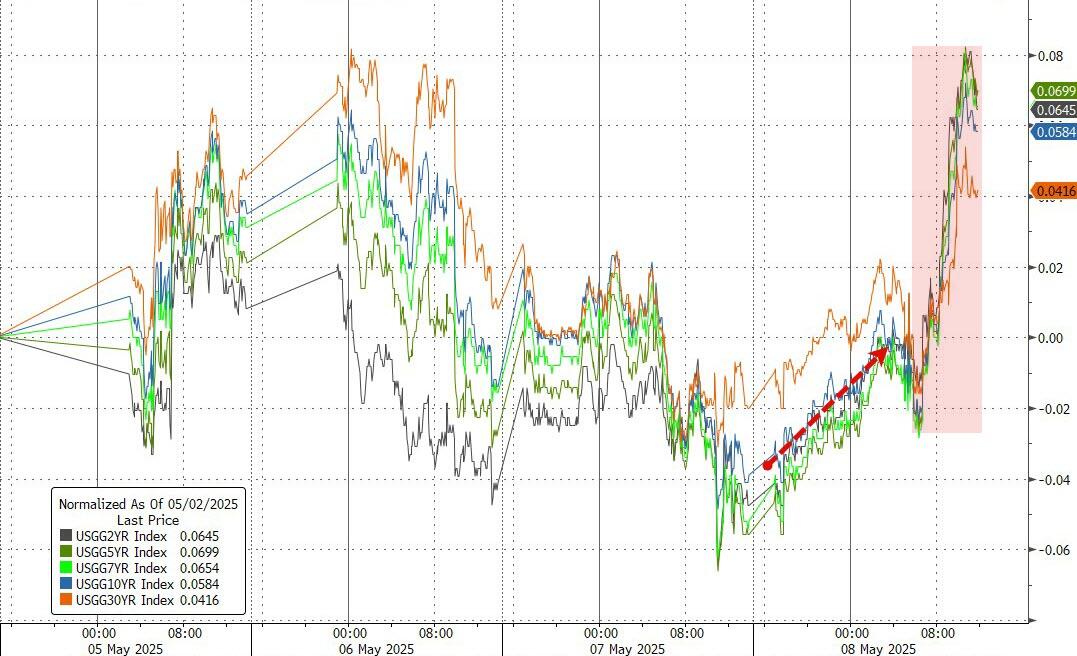
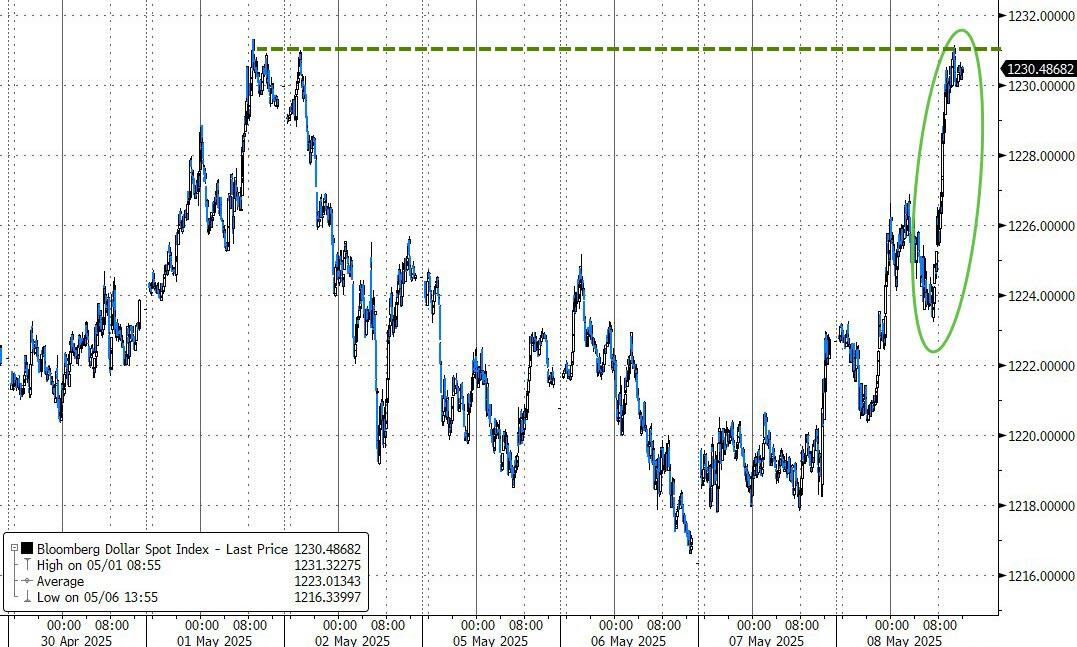
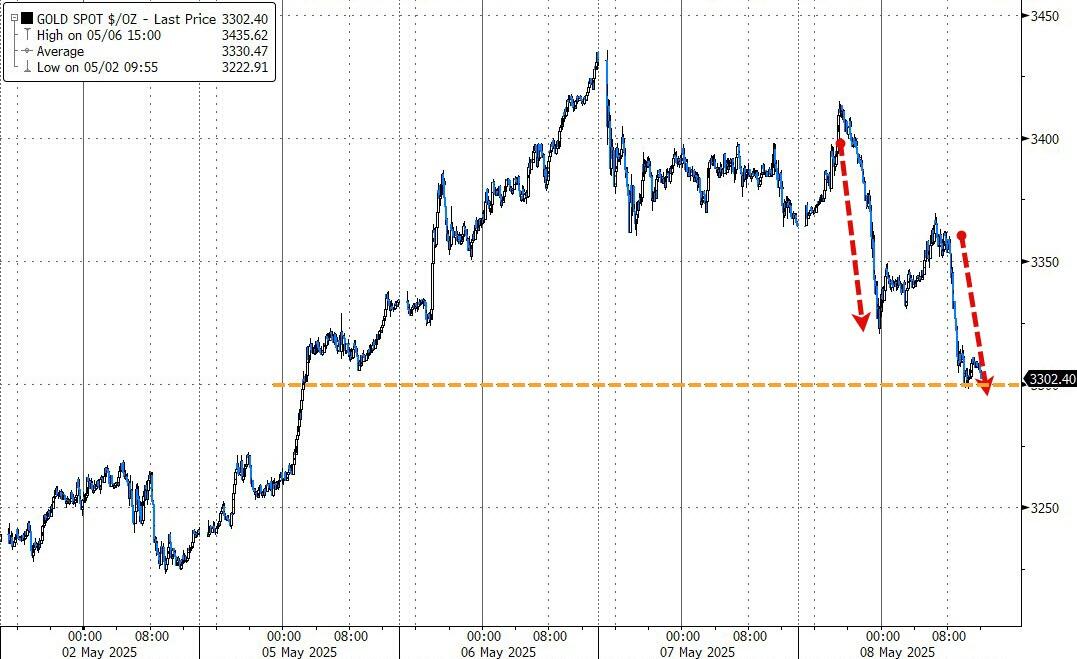
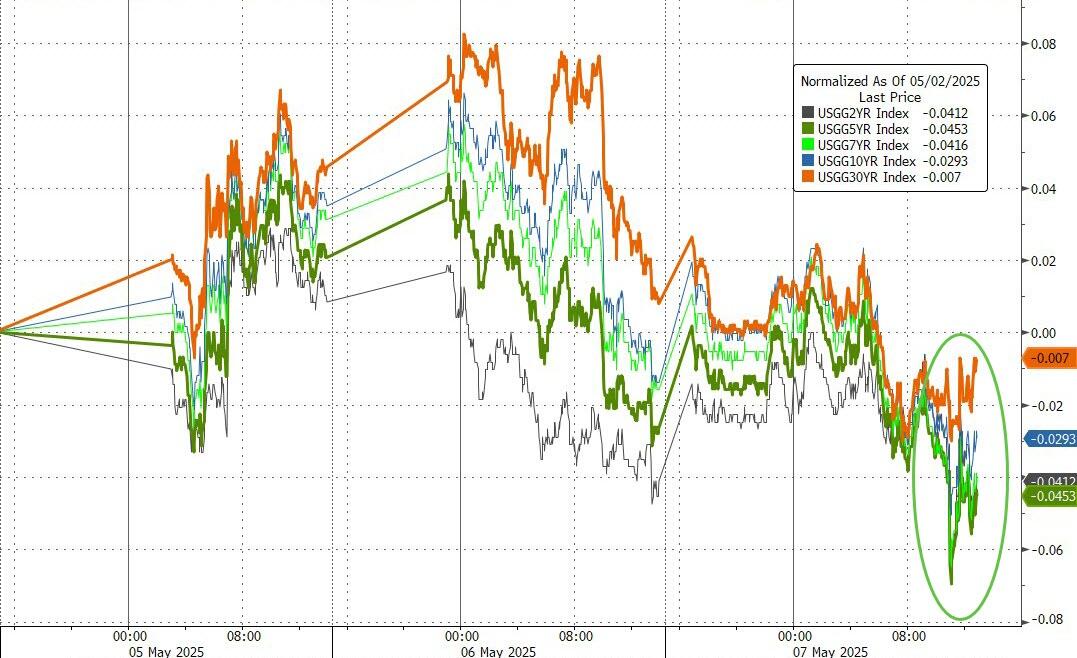
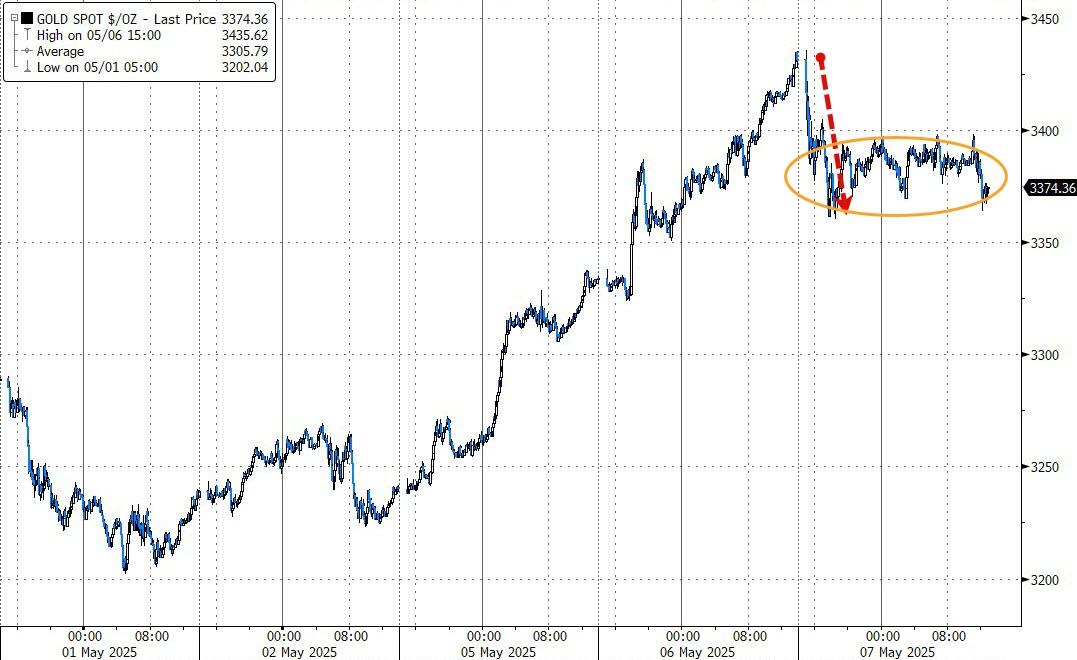
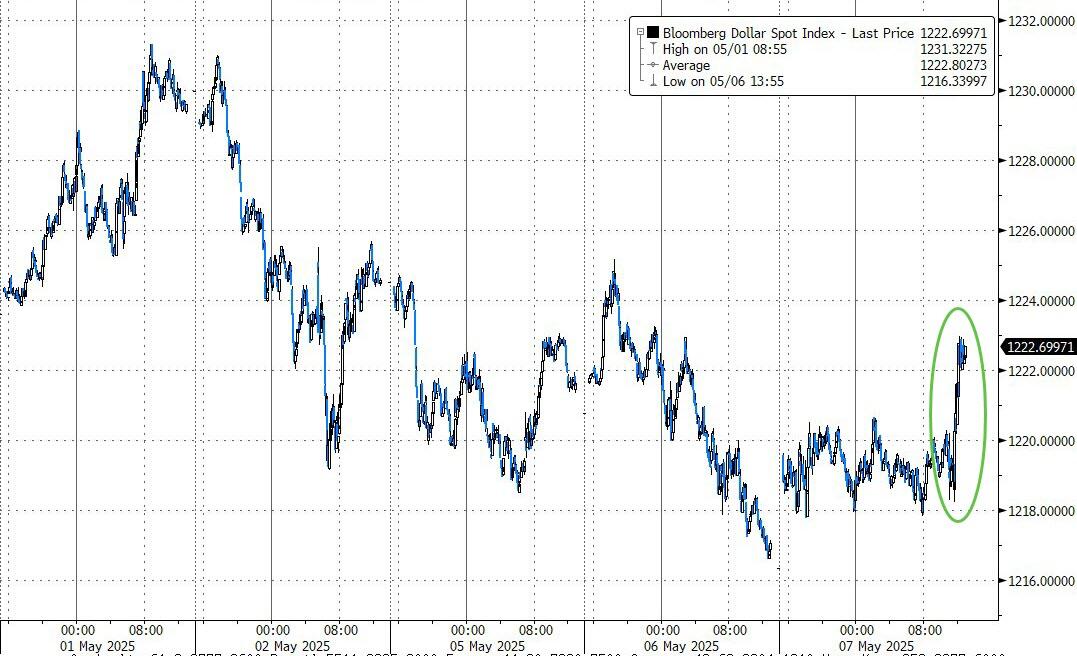
We saw the second-largest short squeeze of the year, as rate-cut expectations plummeted along with recession odds. Bond yields rose as traders shifted towards equities, favoring the dollar, and causing gold to drop, although the precious metal found support at the $3,200 level.
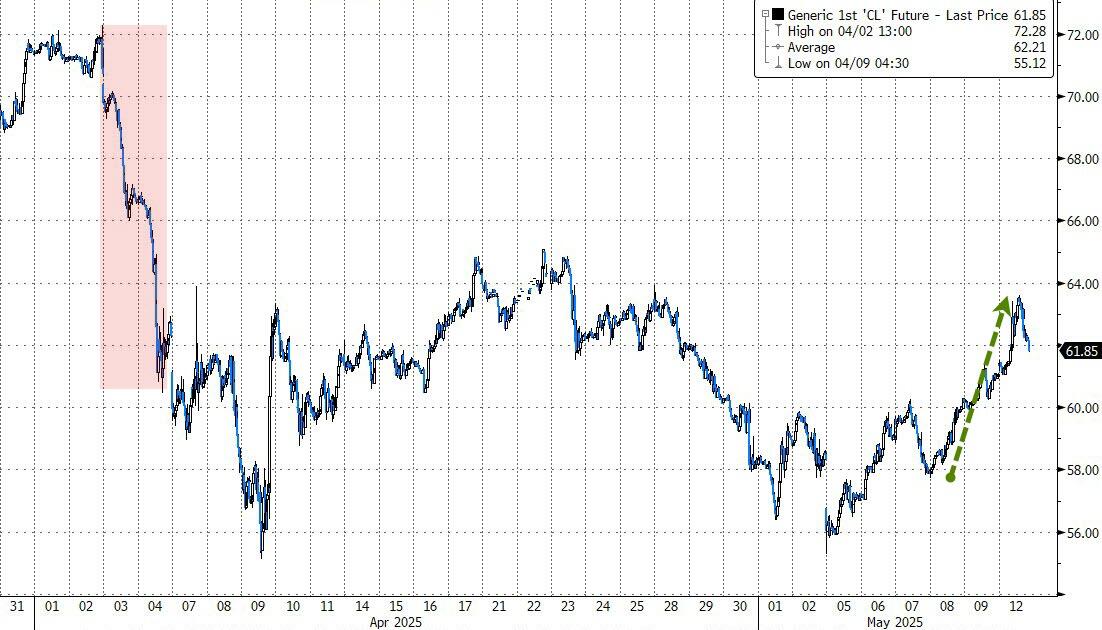
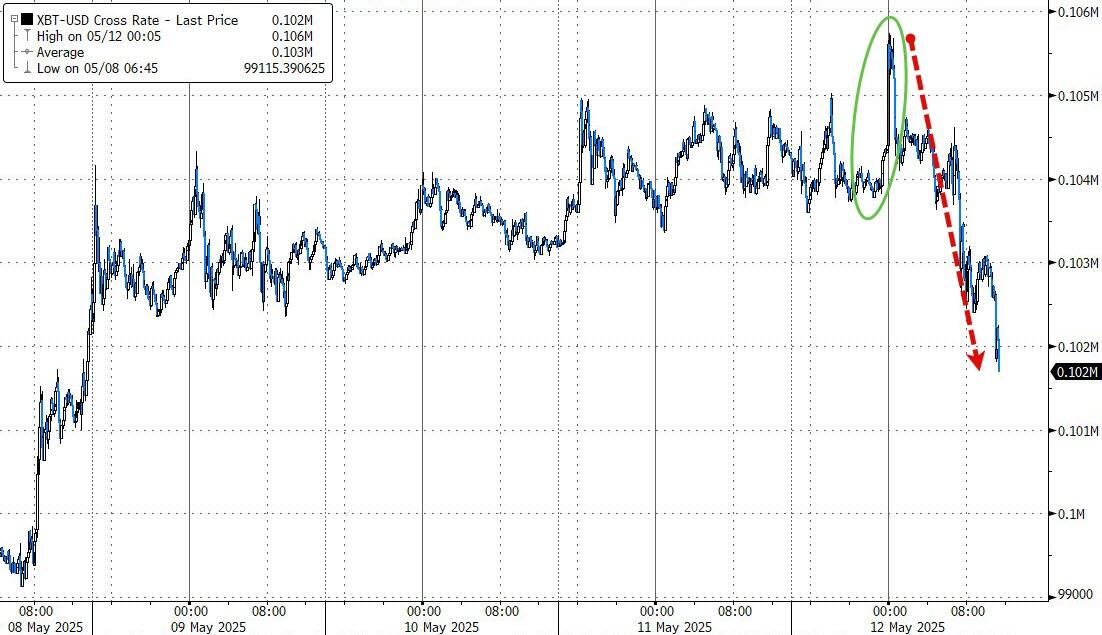
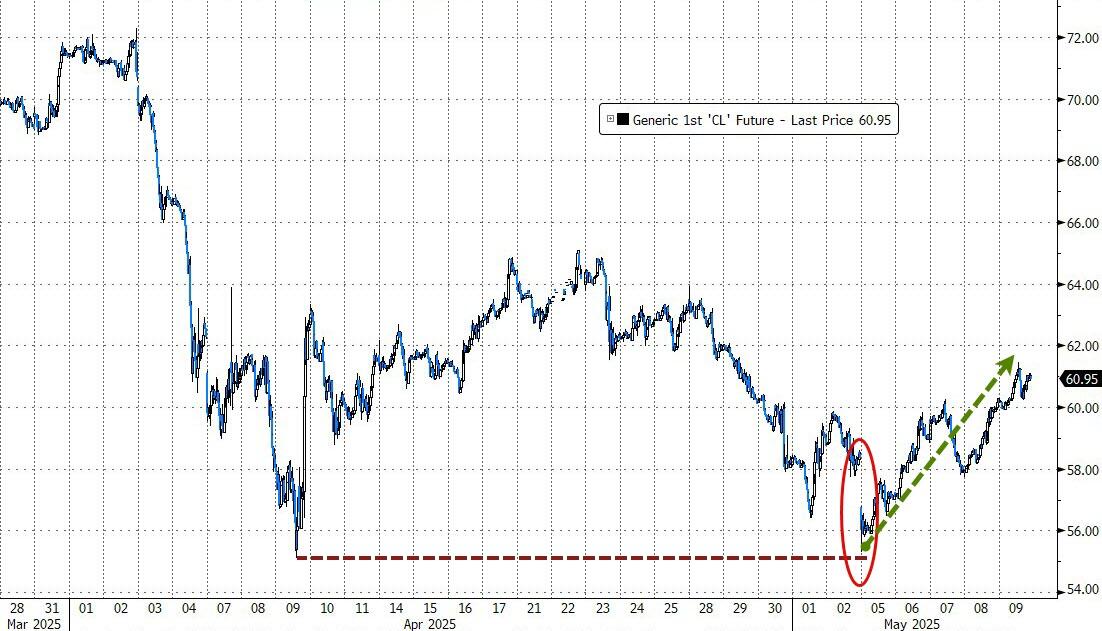
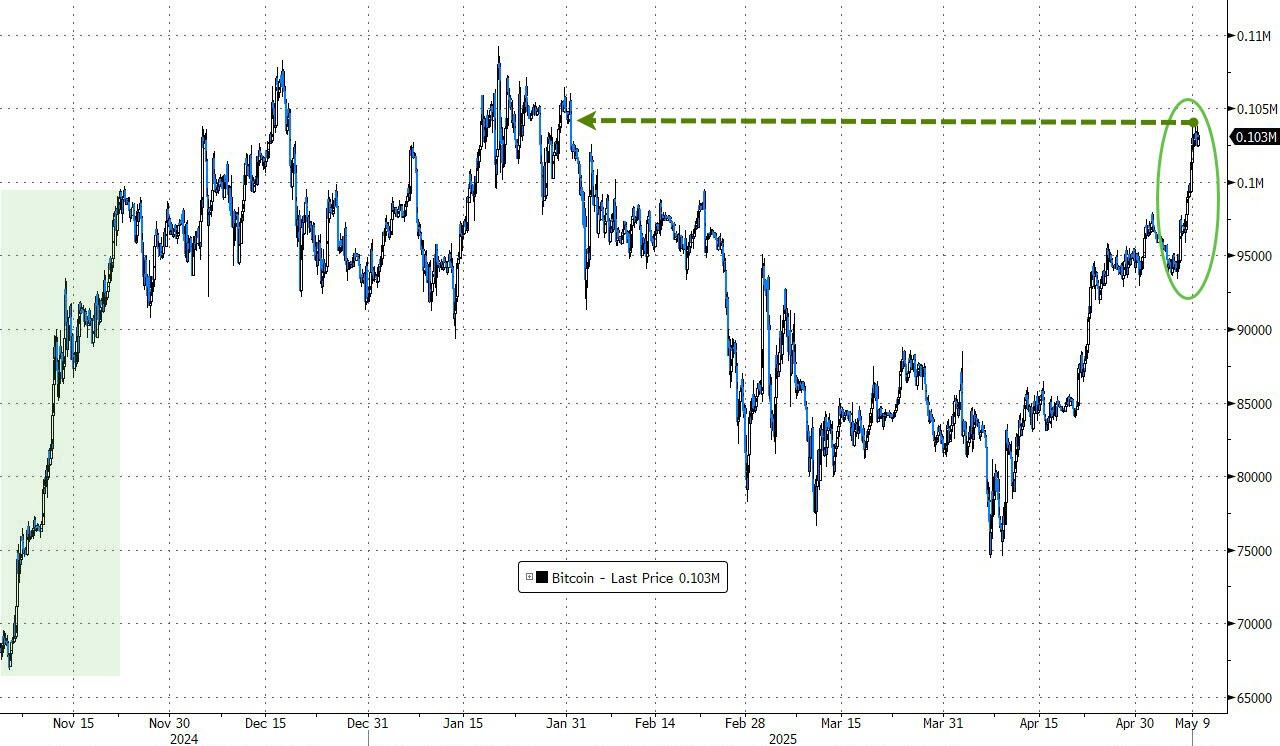
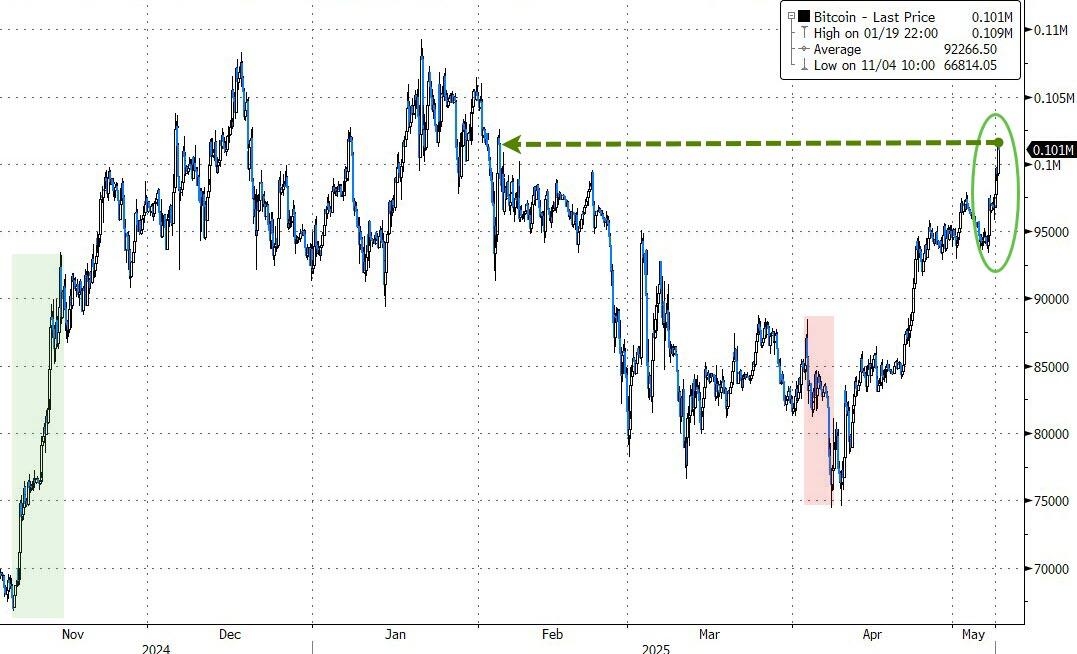
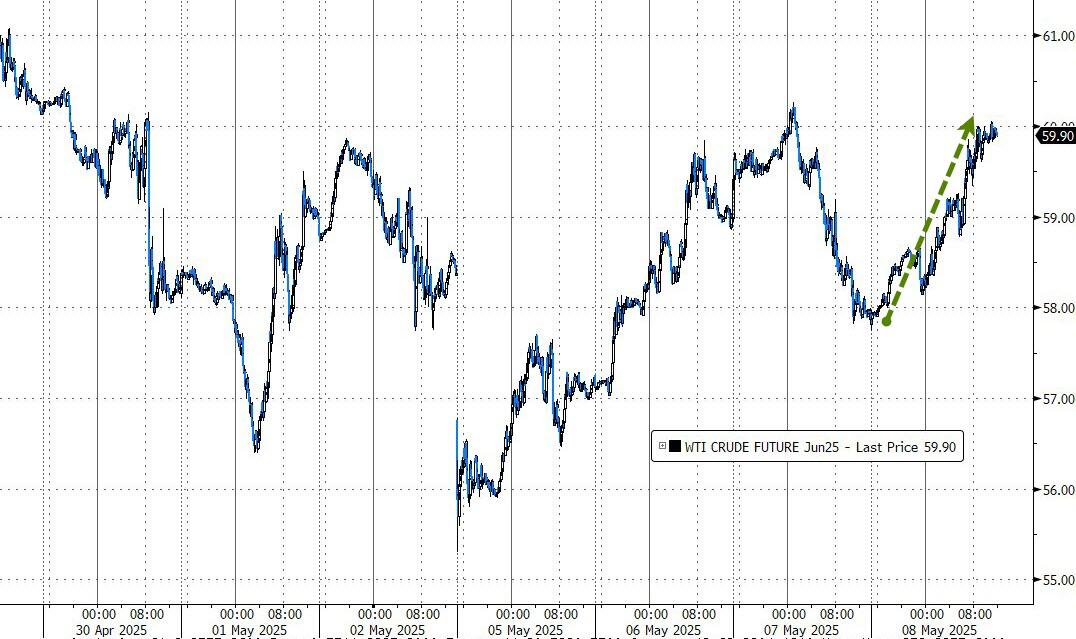
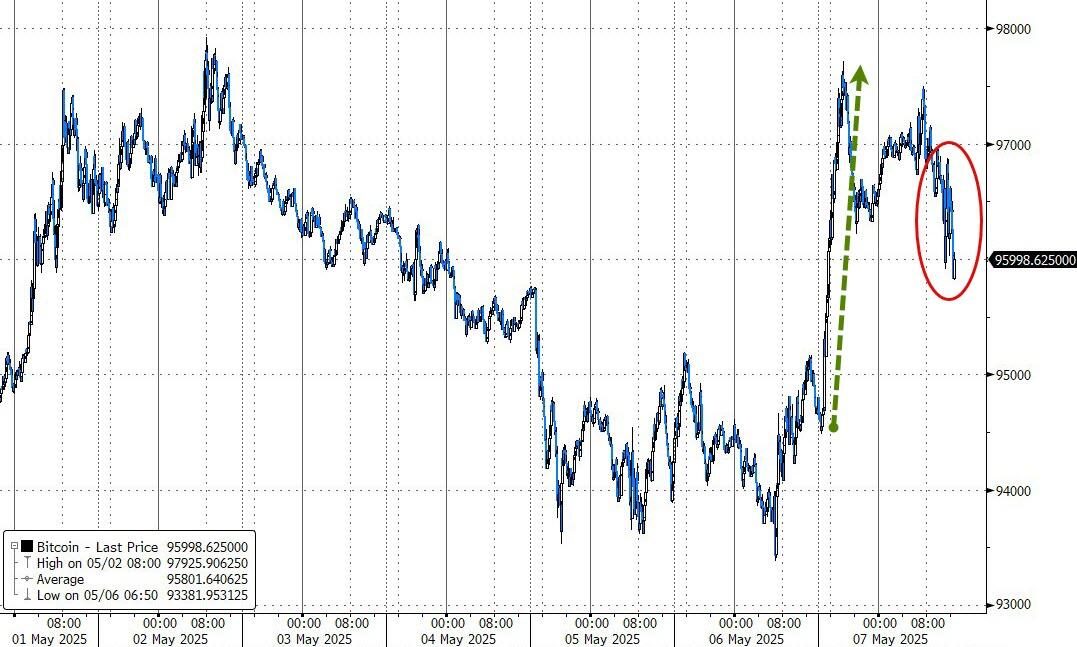
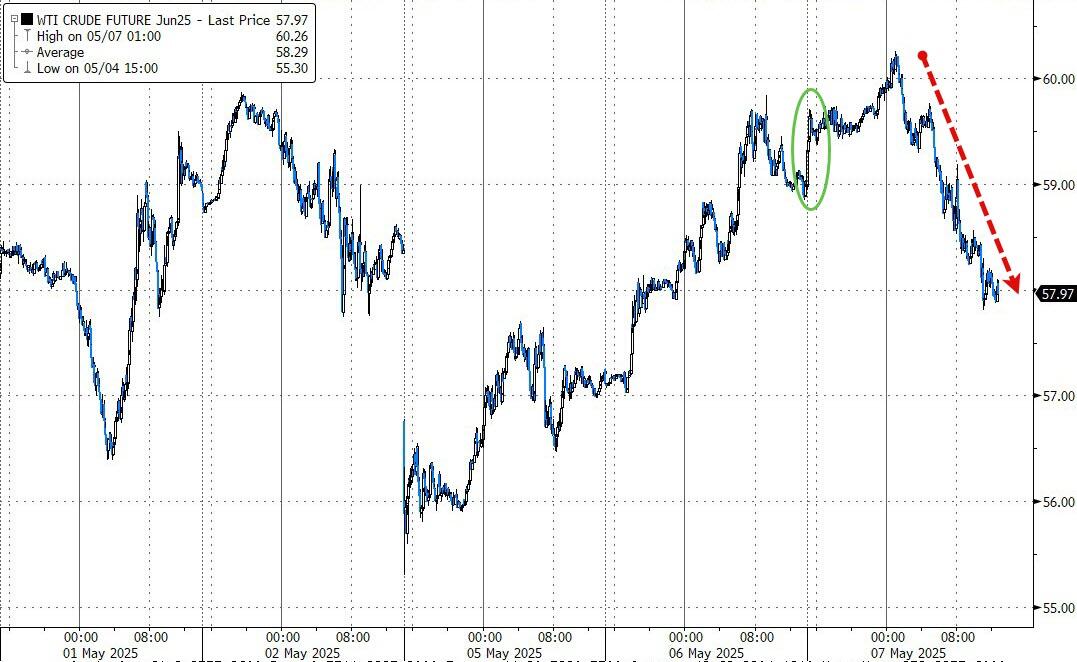
Crude oil maintained its overnight gains, while Bitcoin surged to nearly $106k overnight before retreating to $102k during the day session.
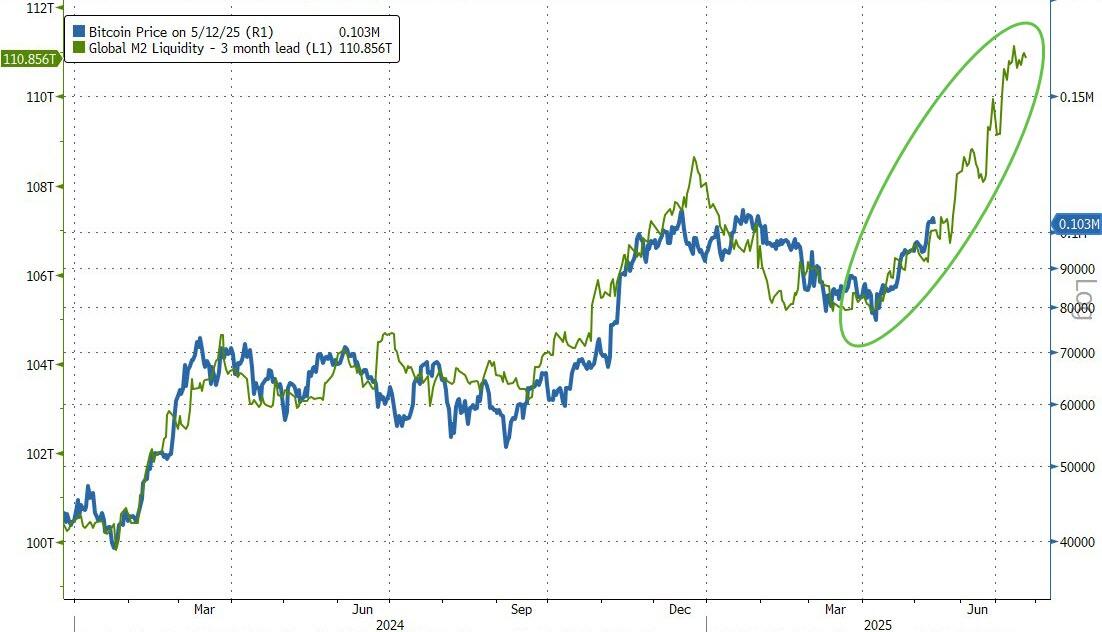
Bitcoin remains aligned with global liquidity (with a three-month lag), and some traders are now forecasting a price point above $150k by July.
Do you want to know which ETFs are hot and which ones are not? Then you need my High-Volume ETF Cutline report. It tells you how close or far each of the 311 ETFs I follow is from its long-term trend line (39-week SMA). These are the ETFs that trade more than $5 million a day, so they are not some obscure funds that nobody cares about.
The report is split into two parts: The winners that are above their trend line (%M/A), and the losers that are below it. The yellow line is the line of shame that separates them. You can see how many ETFs are in each group and how they have changed since the last report (108 vs. 131 current).
With the much-anticipated trade talks between the U.S. and China scheduled for this weekend, equities slipped in early trading as anxiety prevailed on Wall Street.
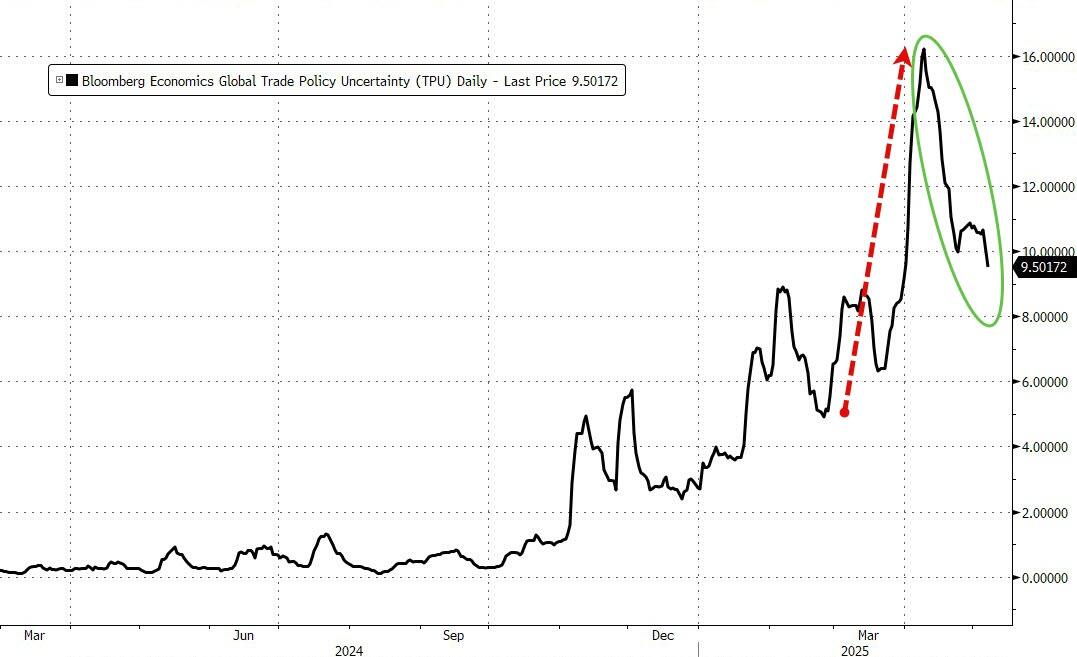
There is hope that following the U.S.-U.K. trade agreement, other major nations will quickly establish similar frameworks. However, the 10% tariff rate on the U.K. appears to be the new global baseline, although trade policy uncertainty continued to decline this week.
President Trump mentioned that an “80% tariff on China seems right,” which would be a significant de-escalation from the original 145%. It remains unclear if these tariffs could be reduced further or if they will be temporary or long-term.
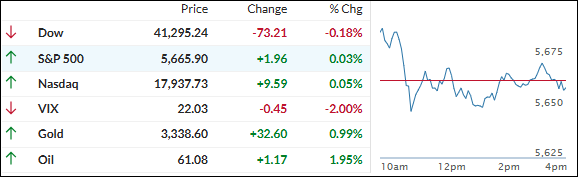
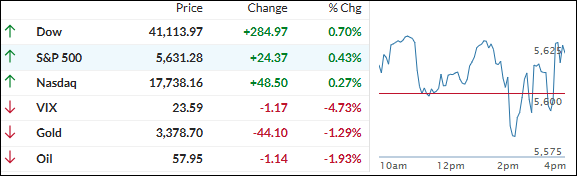
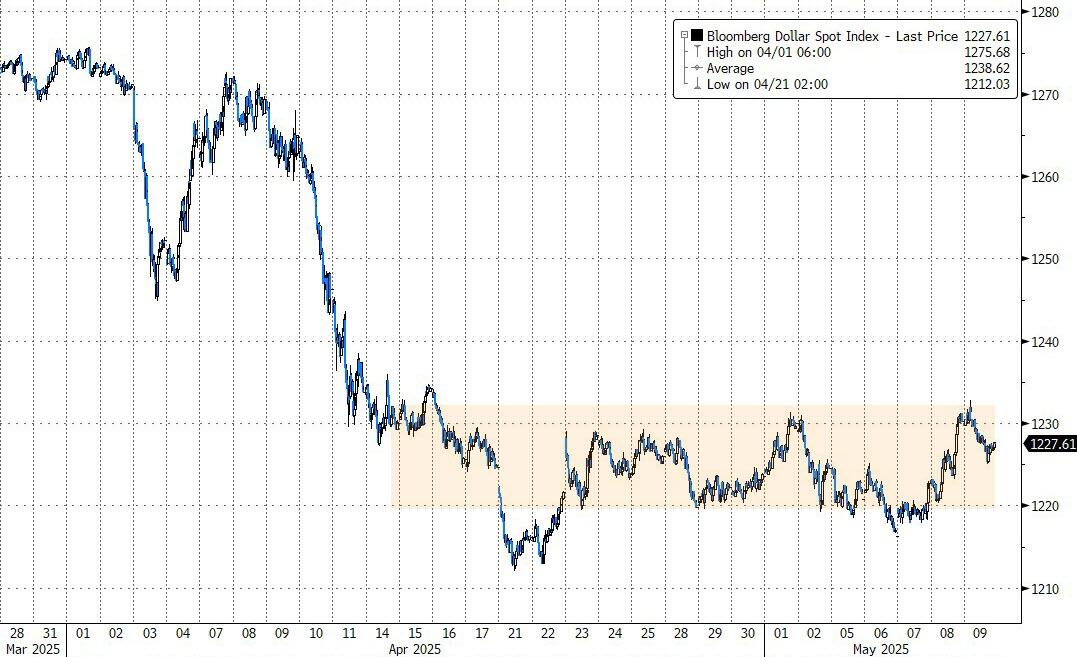
The major indexes ended the day with only minor changes. Rate-cut expectations tumbled, and bond yields rose over the week. The dollar gained modestly but remained within its recent trading range.
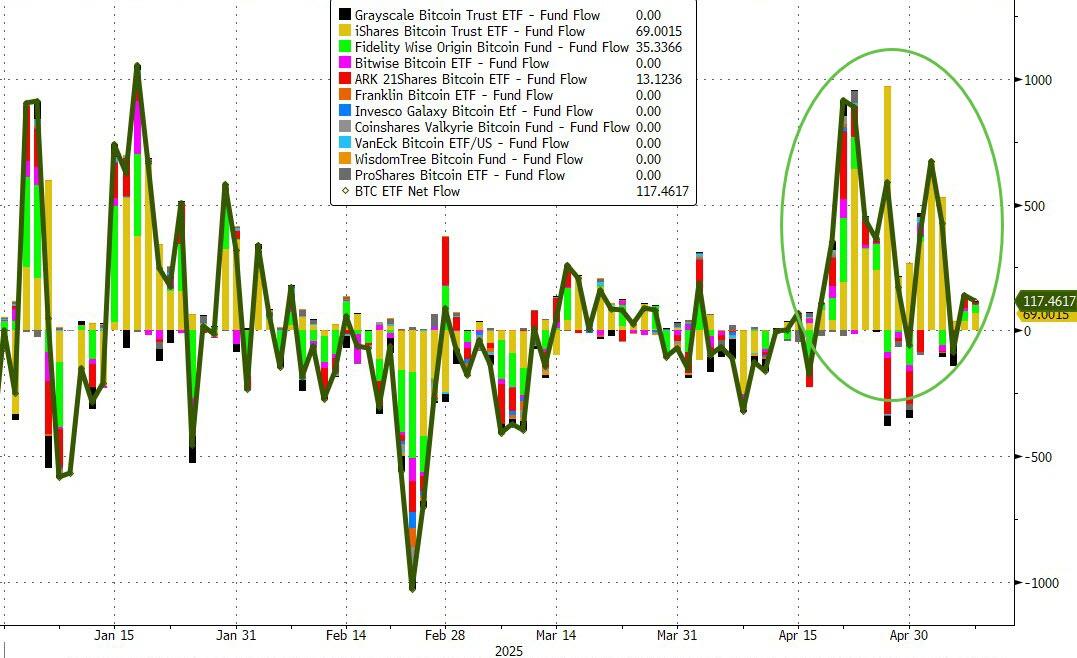
Crude oil found support at 4-week lows and surged, while Bitcoin broke back above $100k for the first time in three months, driven by strong ETF inflows. Gold also climbed but retreated from its highs, with the $3,300 level providing support.
Looking ahead, the outcome of the U.S.-China trade negotiations this weekend, along with economic data on CPI, PPI, retail sales, industrial production, and housing starts, will contribute to a week filled with uncertainty and anxiety.
Out of the 1,800+ ETFs out there, I only pick the ones that trade over $5 million per day (HV ETFs), so you don’t get stuck with a lemon that nobody wants to buy or sell.
Trend Tracking Indexes (TTIs)
These are the main indicators that tell you when to buy or sell Domestic and International ETFs (section 1 and 2). They do that by comparing their position to their long-term M/A (Moving Average). If they cross above, and stay there, it’s a green light to buy. If they fall below, and keep going, it’s a red light to sell. And to make sure you don’t lose your shirt if things go south, I also use a 12% trailing stop loss on all positions in these categories.
All other investment areas don’t have a TTI and should be traded based on the position of each ETF relative to its own trend line (%M/A). That’s why I call them “Selective Buy.” In other words, if an ETF goes above its own trend line, you can buy it. But don’t forget to use a trailing sell stop of 12%, or less if you’re feeling nervous.
If some of these words sound like Greek to you, please check out the Glossary of Terms and new subscriber information in section 9.
DOMESTIC EQUITY ETFs: SELL— effective 4/4/2025
Click on chart to enlarge
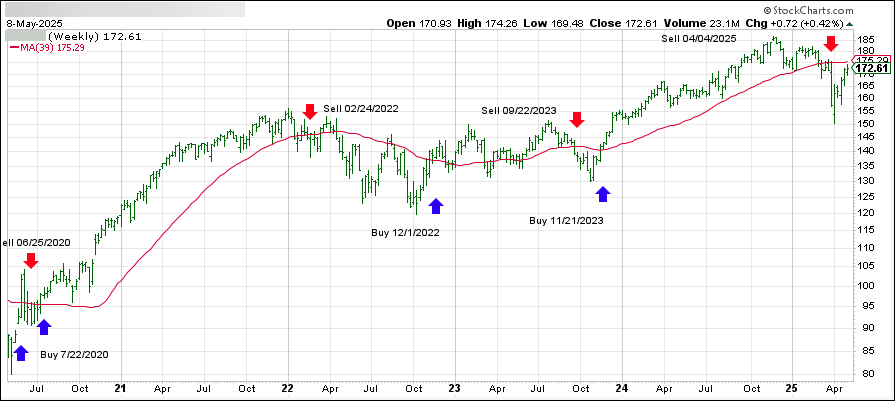
This is our main compass, the Domestic Trend Tracking Index (TTI-green line in the above chart). It has broken below its long-term trend line (red) by -1.41% and has moved into “Sell” mode as of 4/4/2025.
The link below shows all High Volume (HV) Domestic Equity ETFs. They are ranked by M-Index, which is my secret sauce for measuring momentum. Prices in all linked tables below are updated through 05/08/2025, unless otherwise noted. Price data not yet available at publication is indicated with 00.00% or -100.00%. Please note that distributions are not included in the current momentum numbers.
If the TTI is above the trend line, you can use the tables in the link below to pick your winners:
This is our global guide, the International Trend Tracking Index (green). It has broken above its long-term trend line (red) by +3.13% and is now in “Buy” mode as of 5/7/25.
The list in the link below shows the High Volume (HV) International ETFs I track for you during a Buy cycle. They are also ranked by M-Index:
This is the mother of all lists, showing all ETFs I track and how they stack up against each other. The sorting order is by M-Index too. Momentum figures for all ETFs are not adjusted for dividends.
This is where you can find HV ETFs for specific countries or regions that I watch every week. Please note that the data in this table does not include adjustments due to distributions. Country funds can be wild beasts, so make sure you use a trailing stop loss (I use 10%) to protect yourself from nasty bites.
This is where you can diversify your portfolio by looking for different opportunities in various sectors of the market. The table of HV Sector ETFs in the following link covers a wide range of possibilities. The sorting order is by M-Index:
Here too, I recommend using a 10% trailing stop loss to limit your risk.
BOND & DIVIDEND ETFs: SELECTIVE BUY
If you like getting paid for holding ETFs, here’s a list of bond and dividend paying ETFs. But before you buy them, make sure you check their momentum figures first. Then you can visit your favorite financial web site to see their yield and other details.
Please note that the data in this table does not include adjustments due to distributions.
Please note that some of these funds try to beat the index they are tied to by a certain percentage. This can boost your returns, but it can also magnify your losses. So be careful and use a trailing sell stop (I suggest 10%) and be ready for some bumps along the way.
NEW SUBSCRIBER INFORMATION
To get a head start on more successful investing, please click on:
In case you missed it, you can download my latest e-book “How to beat the S&P 500…with the S&P 500,” here. If you are investing your 401k and must use mutual funds, I suggest you mainly stick with the S&P 500 as described in my book. Of course, you can always use the above tables to find sector or country ETFs that suit your taste and use the equivalent mutual funds as offered by your custodian.
Disclosure:
I must tell you that I, as well as my advisory clients, own some of the ETFs listed in the above table. Also, they are not meant to be specific investment recommendations for you, they just show which ETFs from my universe are doing well right now.
Equities advanced this morning, buoyed by Trump’s announcement of a finalized trade deal between the U.S. and the United Kingdom. “It’s a full and comprehensive one,” he elaborated, “which will cement the relationship between our countries for many years to come.”
Tech shares received a boost from news that the current administration will rescind the Biden-era AI chip controls, which were set to take effect later this month. Nvidia, Intel, and AMD all climbed, joined by Amazon and Tesla.
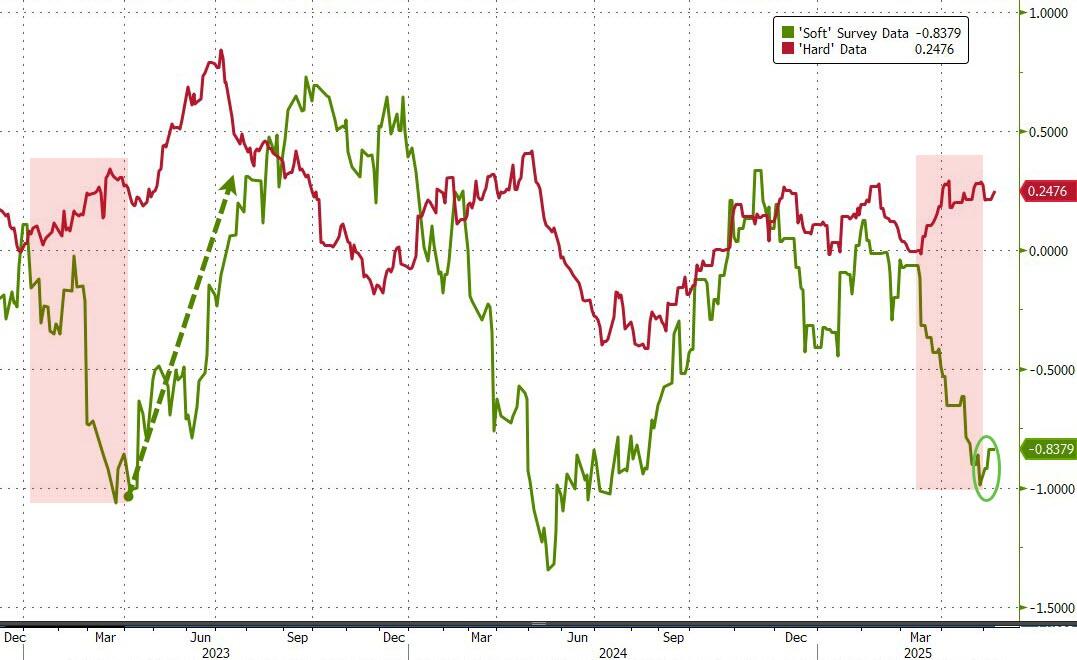
Although the Fed’s announcement to hold rates steady is now behind us, concerns persist that “soft” data like sentiment and confidence will eventually impact “hard” data such as retail sales, GDP, and employment. However, this concern has not yet materialized.
Overall, today’s market news was positive, with more favorable developments than negatives. This optimism reduced rate-cut expectations as “soft” data showed signs of improvement.
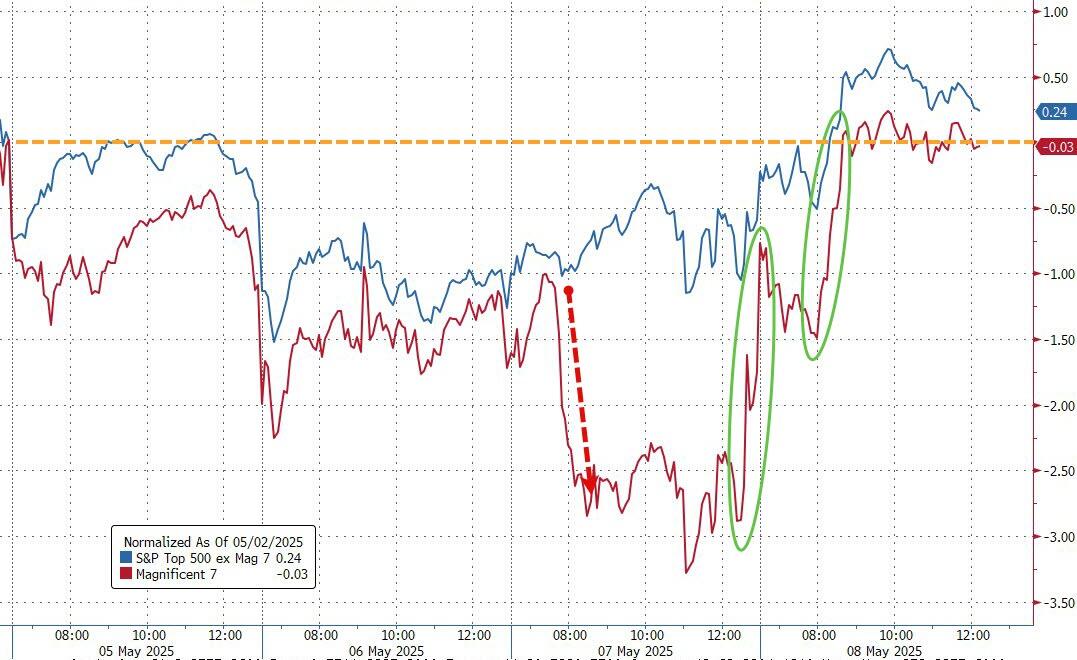
Small Caps outperformed, driven by a massive short-squeeze, which also benefited the Mag7 basket, despite surging bond yields. The dollar returned to one-week highs, causing gold to retreat, with the precious metal finding support at $3,300.
Bitcoin continued its rally, surpassing the $101k level for the first time since February. Crude oil joined the bullish sentiment, erasing yesterday’s losses.
While our International TTI has signaled a “Buy,” based on today’s action, the Domestic TTI may not be far behind.
Stocks received an early boost after Disney reported an unexpected jump in streaming subscribers, pushing its stock up by 10%.
Adding to the early bullish sentiment was news that Treasury Secretary Bessent and a top trade official will meet their Chinese counterparts this week in Switzerland. Traders viewed this as a potential de-escalation on the trade front, which had previously caused chaotic market action.
Later in the day, the Federal Reserve’s decision on interest rates was highly anticipated, with nearly 100% certainty that the bank would hold rates steady. Equally important was Fed Chair Powell’s press conference, which provided further insights into the direction of interest rates.
Today’s session was choppy, with major indexes fluctuating due to various headlines. Positive news included scheduled China trade talks for Sunday and Trump’s announcement to rescind global chip curbs. Negative news involved Apple considering replacing the Google search engine and Trump’s refusal to preemptively lower China’s tariffs.
As expected, the Fed held rates steady, and Powell’s press conference was summarized by one economist as a “nothingburger,” with rate-cut expectations slipping. Powell highlighted several key points:
– Inflationary effects of policies could be short-lived.
– Uncertainty about the path of the economy is extremely elevated.
– No slowdown is evident in actual economic data yet.
– Costs of waiting are fairly low.
Bond yields pulled back, Bitcoin jumped but retreated from its intraday highs, gold remained stagnant, the dollar showed signs of life, and crude oil slipped again.
With the Fed decision out of the way, headline-driven market volatility will likely continue tomorrow.