ETF/No Load Fund Tracker Newsletter For Friday, February 7, 2014
ETF/No Load Fund Tracker StatSheet
————————————————————-
THE LINK TO OUR CURRENT ETF/MUTUAL FUND STATSHEET IS:
https://theetfbully.com/2014/02/weekly-statsheet-for-the-etfno-load-fund-tracker-newsletter-updated-through-02062014/
————————————————————
Market Commentary
Friday, February 7, 2014
EQUITIES END WEEK ON A POSITIVE NOTE
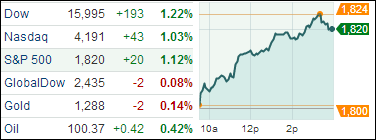
[Chart courtesy of MarketWatch.com]
1. Moving The Markets
The U.S. stock market finished the week on a positive note. The Nasdaq gained over 1.4%, while the S&P 500 and Dow each gained over 1%. The market dug itself a hole at the start of the week, plunging more than 2 percent on Monday. The slide began with investor anxiety over an industry survey that found that manufacturing grew much more slowly in January than in December. Lackluster U.S. auto sales for January added to the bad news.
Investor sentiment began to brighten by Wednesday with a survey of private businesses that showed companies added 175,000 jobs in January, which was in line with average monthly gains the past two years. On Thursday, news that fewer people applied for unemployment benefits last week helped lift the market. On Friday, the market’s gains were broad. All 10 sectors in the S&P 500 index moved higher, led by industrial and health care stocks.
Some stocks missed the rally. LinkedIn fell $13.86 or 6.2 percent, to $209.59 after the company said its performance may falter this year as it spends more on long-term projects and revenue growth slows.
Investors will have no shortage of potentially market-moving news to watch out for in the coming weeks. The bulk of the latest quarterly earnings cycle is over, but the markets will be watching how Washington grapples with another debt ceiling deadline, and how quickly the Federal Reserve moves to reduce its monthly bond purchases.
Our 10 ETFs in the Spotlight recovered and backed away from their trailing sell stops; 9 of them are remaining on the bullish side of their respective trend lines as the tables below show.
2. ETFs in the Spotlight
In case you missed the announcement and description of this section, you can read it here again.
It features 10 broadly diversified ETFs from my HighVolume list as posted every Monday. Furthermore, they are screened for the lowest MaxDD% number meaning they have been showing better resistance to temporary sell offs than all others over the past year.
In other words, none of them ever triggered their 7.5% sell stop level during this time period, which included a variety of severe market pullbacks but no move into outright bear market territory.
Here are the 10 candidates:
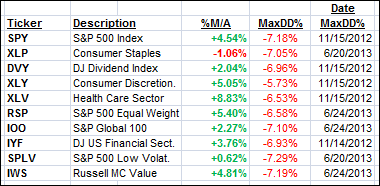
All of them, except XLP, are in “buy” mode meaning their prices are above their respective long term trend lines by the percentage indicated (%M/A).
Year to date, here’s how the above candidates have fared so far:
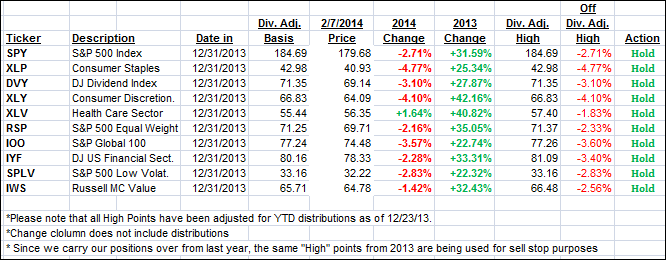
To be clear, the first table above shows the position of the various ETFs in relation to their respective long term trend lines (%M/A), while the second one tracks their trailing sell stops in the “Off High” column.
Personally, I liquidated our holdings in XLY and XLP as their trend lines were broken to the downside. While the past 2 days showed a reversal, I will look for opportunities elsewhere and not repurchase XLY and XLP at this particular time.
3. Domestic Trend Tracking Indexes (TTIs)
Our Trend Tracking Indexes (TTIs) joined the roller coaster of the past week but managed to climb higher thanks or the rally of the past 2 days:
Domestic TTI: +2.53% (last Friday +2.36%)
International TTI: +4.11% (last Friday +3.37%)
Have a great week.
Ulli…
Disclosure: I am obliged to inform you that I, as well as advisory clients of mine, own some of these listed ETFs. Furthermore, they do not represent a specific investment recommendation for you, they merely show which ETFs from the universe I track are falling within the guidelines specified.
————————————————————-
READER Q & A FOR THE WEEK
All Reader Q & A’s are listed at our web site!
Check it out at:
http://www.successful-investment.com/q&a.php
A note from reader Kathy:
Q: Ulli: Two days ago your newsletter said you liquidated these positions but today’s charts are still showing a hold? Am I missing something?
A: Kathy: As I mentioned in the NL, I am tracking 2 different items in the 2 tables. The first one shows any trend line breaks, some of which happened, while the second one tracks the trailing sell stops.
I did sell my positions on a break below the trend line, but you can use the trailing sell stops as well. It all depends on your risk tolerance.
———————————————————-
WOULD YOU LIKE TO HAVE YOUR INVESTMENTS PROFESSIONALLY MANAGED?
Do you have the time to follow our investment plans yourself? If you are a busy professional who would like to have his portfolio managed using our methodology, please contact me directly or get more details at:
https://theetfbully.com/personal-investment-management/