ETF/No Load Fund Tracker Newsletter For Friday, February 14, 2014
ETF/No Load Fund Tracker StatSheet
————————————————————-
THE LINK TO OUR CURRENT ETF/MUTUAL FUND STATSHEET IS:
https://theetfbully.com/2014/02/weekly-statsheet-for-the-etfno-load-fund-tracker-newsletter-updated-through-02132014/
————————————————————
Market Commentary
Friday, February 14, 2014
EQUITIES STUCK IN RALLY MODE
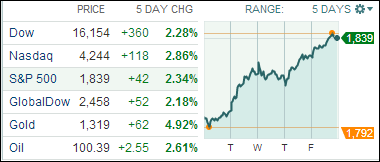
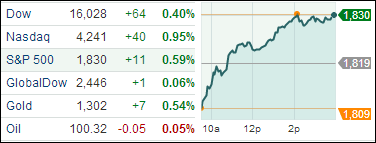
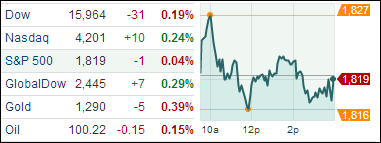
[Chart courtesy of MarketWatch.com]
1. Moving The Markets
Another week of trading has come to a close with stocks gaining for a second straight week and the Nasdaq closing at its highest level since 2000. Let’s recap the trends and events that took place this week. Many were holding their breath to start the week in anticipation of Janet Yellen’s address to Congress. Yellen’s speech turned out to be good news for the markets, which reacted positively during Tuesday’s trading. She was confident that, even though employment rates have been weak, the Fed will stay on track to reduce their bond buying program.
Thursday brought us news that jobless claims for the week ending Feb. 8 came in slightly higher than expected, but retail sales figures missed estimates. Also on Thursday, it was revealed that Time Warner Cable (TWC) will be acquired by Comcast (CMCSA), a merge that will have an unforeseeable impact on the cable TV/Internet market. Friday’s trading closed out the week on the up-and-up as consumer sentiment beat expectations and we received some solid earnings reports from companies such as Cliffs Natural Resources (CLF) and Campbell Soup (CPB).
As earnings season draws to a close, there are still a few key firms left to report next week, however, the focus of the markets will likely shift toward macro data as earnings begin to dwindle, and next week is packed with key economic reports from around the world. Monday will see GDP numbers from Japan, though U.S. markets will be closed in observance of President’s Day. Tuesday will bring CPI results from the U.K. and Germany’s economic sentiment figures. Closing out the week will be U.S. CPI and Canada CPI, which are reported on Thursday and Friday, respectively.
Our 10 ETFs in the Spotlight joined the upward movement of the indexes and 3 of them have now turned positive for the year.
2. ETFs in the Spotlight
In case you missed the announcement and description of this section, you can read it here again.
It features 10 broadly diversified ETFs from my HighVolume list as posted every Monday. Furthermore, they are screened for the lowest MaxDD% number meaning they have been showing better resistance to temporary sell offs than all others over the past year.
In other words, none of them ever triggered their 7.5% sell stop level during this time period, which included a variety of severe market pullbacks but no move into outright bear market territory.
Here are the 10 candidates:
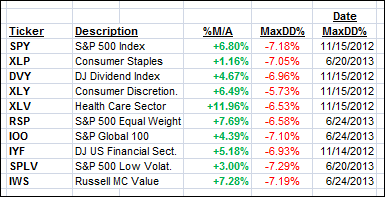
All of them are in “buy” mode meaning their prices are above their respective long term trend lines by the percentage indicated (%M/A).
Year to date, here’s how the above candidates have fared so far:
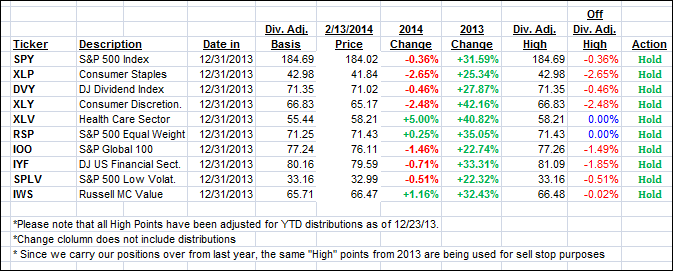
To be clear, the first table above shows the position of the various ETFs in relation to their respective long term trend lines (%M/A), while the second one tracks their trailing sell stops in the “Off High” column.
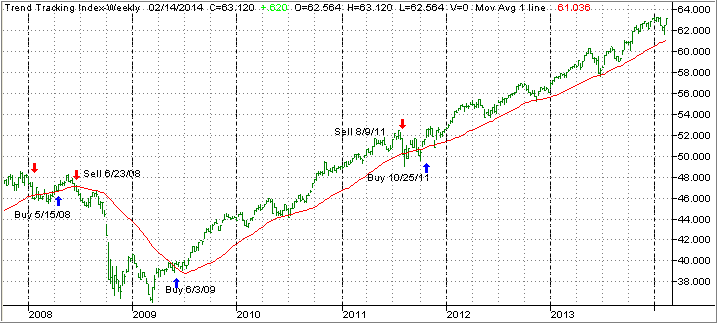
3. Domestic Trend Tracking Indexes (TTIs)
Our Trend Tracking Indexes (TTIs) picked up steam and headed deeper into bullish territory.
Domestic TTI: +3.58% (last Friday +2.63%)
International TTI: +5.65% (last Friday +4.32%)
Have a great week.
Ulli…
Disclosure: I am obliged to inform you that I, as well as advisory clients of mine, own some of these listed ETFs. Furthermore, they do not represent a specific investment recommendation for you, they merely show which ETFs from the universe I track are falling within the guidelines specified.
————————————————————-
READER Q & A FOR THE WEEK
All Reader Q & A’s are listed at our web site!
Check it out at:
http://www.successful-investment.com/q&a.php
A note from reader Kathy:
Q: Ulli: Two days ago your newsletter said you liquidated these positions but today’s charts are still showing a hold? Am I missing something?
A: Kathy: As I mentioned in the NL, I am tracking 2 different items in the 2 tables. The first one shows any trend line breaks, some of which happened, while the second one tracks the trailing sell stops.
I did sell my positions on a break below the trend line, but you can use the trailing sell stops as well. It all depends on your risk tolerance.
———————————————————-
WOULD YOU LIKE TO HAVE YOUR INVESTMENTS PROFESSIONALLY MANAGED?
Do you have the time to follow our investment plans yourself? If you are a busy professional who would like to have his portfolio managed using our methodology, please contact me directly or get more details at:
https://theetfbully.com/personal-investment-management/
———————————————————
Back issues of the ETF/No Load Fund Tracker are available on the web at:
https://theetfbully.com/newsletter-archives/

 Vident Financials broke into the US exchange traded funds market late last year with the launch of the Vident International Equity Fund (VIDI). VIDI turned out to be one of the most successful launches in the history of the industry as the fund recorded more than $100 million in assets within weeks of its unveiling. In less than three months, VIDI’s assets under management have grown to nearly $600 million, showing a CAGR of about 200 percent.