08-05-2014

Ulli Newsletter Archives Contact

The ETF/No Load Fund Tracker

Monthly Review—July 31, 2014

Some US Indexes Slide Into Negative Territory In July; Europe Follows Suit

US equities finished July lower as a combination of disappointing economic news, drab corporate earnings and geopolitical tensions took its toll on investor sentiment, triggering a broad selloff in equities.

The Dow Jones Industrial Average ended the month 1.6 percent lower at 16,563.37 which turned its performance for 2014 negative. The blue-chip index shed 316.99 points, or 1.9 percent, on the last trading day of the month, its worst single-day performance since February 3.

The S&P 500 finished July at 1,930.67, down 1.5 percent for the month. All the 10 sectors of the benchmark index fell more than 1.5 percent on July 31 with energy and telecom stocks leading the losses.

The NASDAQ Composite Index closed at 4,369.77, tallying its monthly loss at 0.7 percent. The tech-heavy index slumped 93.13 points, or 2.1 percent, on the last business day of the month as investors became nervous about the Fed’s trigger points for raising rates ahead of Friday’s payrolls report.

The nonfarm payrolls report, released on the last day of the month, however, fell short of expectations. July US nonfarm payrolls increased by 209,000, which were smaller than the 230,000 gain most economists had forecast. Private payrolls performed worse, gaining only 198,000 jobs after adding 270,000 jobs in June. While the Labor Department revised job gains upwards by a total of 15,000 for May and June, the unemployment rate unexpectedly rose to 6.2 percent in July from 6.1 percent the previous month.

Labor force participation rate, a measure of working-age population in the labor force, ticked up to 62.9 percent from 62.8 percent in June. Average hourly earnings remained flat for the month after rising 0.2 percent in June while U6 unemployment rate, a gauge for under-employed and unemployed workers, inched up to 12.2 percent from 12.1 percent. Average workweek remained unchanged at 34.5 hours, validating Fed Chair Janet Yellen’s observation that there remains “significant underutilization of labor resources” that calls for loose monetary policy “for an extended period of time.”

The US economy continued to paint a mixed picture of recovery, with economic indicators hitting and missing economists’ forecasts in July. The economy made a strong comeback in the second quarter as consumer spending surged and business investments rebounded. Gross domestic product grew at a 4 percent annual pace after contracting by a downwardly-revised 2.1 percent in the first quarter. Consumer spending, the biggest component of the economy, jumped 2.5 percent as spending on big-ticket items such as cars and trucks accelerated. Spending on goods meant to last three years or more soared 14 percent, the biggest increase since 2009.

The Personal Consumption Expenses index, the Fed’s favorite gauge for measuring inflation, meanwhile grew at a 2.3 percent annual pace, the fastest since the second quarter of 2011. Core PCE, which excludes volatile items like food and energy, accelerated to a 2 percent annual clip from 1.2 percent in the first three months. While the Fed believes the sudden jump in inflation is temporary and expects price levels to moderate in the coming months, the central bank could be forced to raise interest rates sooner than it would like if proven wrong.

Pre-owned home sales fell unexpectedly in June, a separate report by the National Association for Realtors revealed. NAR’s Pending Home Sales Index, which is calculated after assessing the number of contracts signed, fell 1.1 percent to 102.7, missing forecasts for a 0.5 percent gain.

Shipment of non-defense capital goods excluding aircrafts, considered as a good proxy for business investments, fell 1 percent in June, while the reading for May was revised downward minus 0.1 percent, indicating business spending could soften in the next quarters.

Across the Atlantic, European stocks tracked Wall Street as weak economic data and falling inflation sapped demand for riskier assets. Weak price levels continued to haunt Europe with July inflation slipping to 0.4 percent from 0.5 percent in the previous two months. The July reading, the lowest since October 2009, is bad news for the European Central Bank as the bank announced a raft of liquidity measures in June to boost the region’s economy and bring inflation up to the bank’s target of 2 percent. Some economists, however, said the drop was temporary and argued a bigger-than-expected dip in non-core prices caused the decline.

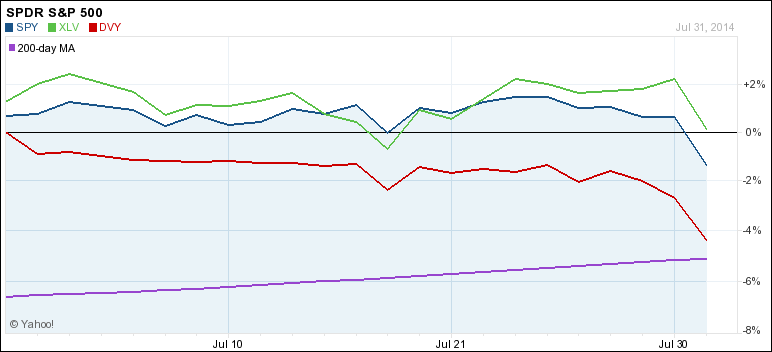
The trend reversal in the indexes affected our holdings to varying degrees. First, the close up performance of our main holdings over the month of July:
Monthly Chart

DVY was the weakling while SPY held up fairly well. Only healthcare (XLV) managed to stay on the plus side of the ledger for this period supporting the leading role it has played all year.

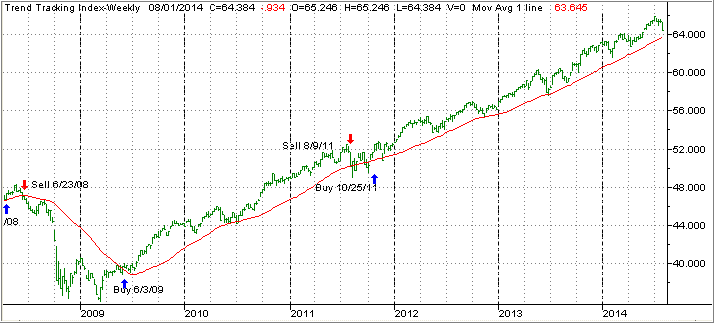
On to the big picture. Our Domestic Trend Tracking Index (TTI) came off its high as the following chart shows:
TTI

Notice how the last green bar on the upper right turned south and headed towards its long-term trend line (red). This happened during the last week of July, however, the TTI remains above is trend line by +1.23% and therefore in bullish territory.

It’s too early to tell if that drop was only an aberration or an indication of things to come. For sure, we are long overdue for a correction. The good news is that it won’t take much of a drop for our above indicator to signal a move out of equities, which means that we will be able to most likely escape with gains on most of our positions rather than losses.

Our trailing sell stops provide another measure of downside protection, which will be sorely needed if and when this cycle comes to its inevitable end.

Equities Attempt To Recover; New Macbook Pros Anyone?

Ulli Market Commentary Contact

Mon pic

[Chart courtesy of MarketWatch.com]

1. Moving the Markets

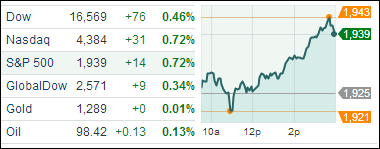
Stocks recovered a bit from some of the losses that were suffered last week. Investors were encouraged by positive corporate earnings announcements, including Berkshire Hathaway (BERK). The S&P 500 posted a 0.72% gain, the Dow rose 0.46% and the Nasdaq also added a 0.72% gain on the day.

In tech news, Apple (AAPL) launched its 13-inch and 15-inch retina display MacBook Pros with faster versions of Intel processors and tons of RAM. Also, reports are saying that Apple will be buying Concept.io, an app that delivers an audio news feed based on stories that it picks up from NPR, TED Talks and the Harvard Business Review. The stock is up 21.65% year-to-date.

Last week, the Dow dropped 2.8%, its biggest weekly drop in six months. The S&P 500 fell 2.7%, its largest percentage drop in over two years. Investors had several reasons to pull back: Argentina’s default, escalating violence in Ukraine, Israel and Gaza, as well as concerns that the Federal Reserve was poised to start raising interest rates next year. Let’s see what new news comes in this week that may shake, rattle and roll the markets.

Our 10 ETFs in the Spotlight joined the turnaround session with 9 of them gaining but no new highs were made.

Read More

ETFs/Mutual Funds On The Cutline – Updated Through 08/01/2014

Ulli Uncategorized Contact

Below are the latest ETF Cutline reports, which show how far above or below their respective long-term trend lines (39 week SMA) my currently tracked ETFs/MFs are positioned.

The first report covers the ETF Master List from Thursday’s StatSheet and includes 398 ETFs, of which currently 297 (last week 362) are hovering in bullish territory.

The second report includes only High Volume ETFs. To clarify, High Volume (HV) ETFs are defined as those with an average daily volume of $10 million or higher.

These ETFs are generated from my selected list of some 97 that I use in my advisor practice. It cuts out the “noise,” which simply means it eliminates those ETFs that I would never buy because of their volume limitations. 67 ETFs (last week 86) have managed to remain in bullish territory after the recent market volatility.

The third report covers Mutual Funds on the Cutline. There are currently 612 (last week 742) above the line and 238 below it out of the 850 that I follow.

Take a look:

1. ETF Master Cutline Report     

2. ETF High Volume Cutline Report

3. MF Cutline Report

In case you are not familiar with some of the terminology used in the reports, please read the Glossary of Terms.

If you missed the original post about the Cutline approach, you can read it here.

One Man’s Opinion: Will The Fed Change Its Course After The Latest Nonfarm Payroll Report?

Ulli Market Review Contact

92835431

The July payroll report showed the economy added 209,000 jobs for the month. A number that close to economists’ forecast of a 230,000 jobs gain indicates it is in-line with expectations and the street shouldn’t really be disappointed, particularly as job gains for May were revised upwards to 298,000.

However, the lack of growth in the average earnings-hour is a negative since wage-inflation is required for general price levels to rise. The July unemployment rate ticked up to 6.2 percent from 6.1 percent the previous month. It went up possibly because of more people entering the labor force, and hence, should not be a matter of much concern.

It’s basically a goldilocks report in the sense that it’s on expectations, said Alan Krueger, a Princeton University professor of economics and former chairman of the White House Council of Economic Advisers. The uptick in unemployment rate is within the statistical margin of error and not a significant statistical movement. The increase in the labor participation rate was also not statistically significant. The slight gain in unemployment could be noise though it would be encouraging if more people came back to the labor force.

Read More

New ETFs On The Block: Calamos Focus Growth ETF (CFGE)

Ulli Uncategorized Contact

56371366Calamos Investments, the Naperville, Chicago-based $25.3 billion investment manager better known for its line-up of mutual funds, forayed into the ETF world with the introduction of the Calamos Focus Growth ETF (CFGE) in an attempt to leverage its stock-picking skills.

The Calamos Focus Growth Mutual Fund, which is nearly 11 years old and manages $74 million in assets, returned more than 30 percent over the past year, easily beating the three broad equity indexes.

The new fund, which is listed on the NASDAQ, ventures into the thinly populated world of actively-managed equity ETFs. Most of the more than 90 US-listed actively-managed ETFs are focused on fixed-income products, and Calamos’ expertise in growth investment and active management is likely to give the fund an advantage as it enters an arena that some analysts believe will see robust growth with the picking up of the business cycle.

Read More

08-01-2014

Ulli Newsletter Archives Contact

ETF/No Load Fund Tracker Newsletter For August 1, 2014

ETF/No Load Fund Tracker StatSheet

————————————————————-

THE LINK TO OUR CURRENT ETF/MUTUAL FUND STATSHEET IS:

https://theetfbully.com/2014/07/weekly-statsheet-for-the-etfno-load-fund-tracker-newsletter-updated-through-07312014/

————————————————————

Market Commentary

Friday, August 1, 2014

STOCKS END THE WEEK ON A SOUR NOTE AMIDST ARGENTINEAN DEBT CONCERNS

Fri pic

[Chart courtesy of MarketWatch.com]

1. Moving the Markets

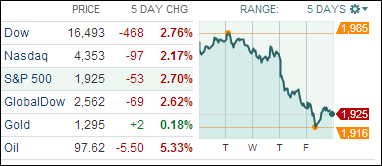
U.S. stocks fell for a second day Friday, adding to the massive sell-off the day before and giving the market its worst week in two years. The S&P 500 fell 53 points to 1,925, down 2.63%.  The Dow Jones Industrial Average fell 468 points to end the week at 16,493, down 2.8%, and the Nasdaq dropped 2.17%.

Argentina captured headlines today when it was announced that the country defaulted on its debt, raising fears among skittish investors already fretting about corporate earnings growth, rising interest rates, global conflict and an aging bull market.

Energy and financial stocks were among the biggest decliners. Chevron (CHEV), the nation’s second-largest oil and gas company behind Exxon Mobil (XOM), fell $1.34, or 1%, to $127.90. While Chevron’s earnings were better than analysts had predicted, the company’s oil and gas production fell in the quarter.

Investors did get some good news about the U.S. economy though today. The Labor Department said that U.S. employers created 209,000 jobs in July, while the unemployment rate rose to 6.2% from 6.1%. July was the sixth-straight month that U.S. employers created more than 200,000 jobs, a sign that the U.S. economy continues to recover. Economists also pointed out that the rise in the unemployment rate was likely due to more out-of-work people actively looking for jobs.

Our 10 ETFs in the Spotlight ended up mixed today with 4 of them gaining and 6 of them losing; no new highs were made but 1 ETF slipped into the red YTD.

2. ETFs in the Spotlight

In case you missed the announcement and description of this section, you can read it here again.

It features 10 broadly diversified ETFs from my HighVolume list as posted every Monday. Furthermore, they are screened for the lowest MaxDD% number meaning they have been showing better resistance to temporary sell offs than all others over the past year.

Here are the 10 candidates:

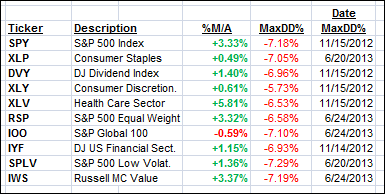
MaxDD

9 of them are in “buy” mode, meaning their prices are above their respective long term trend lines by the percentage indicated (%M/A).

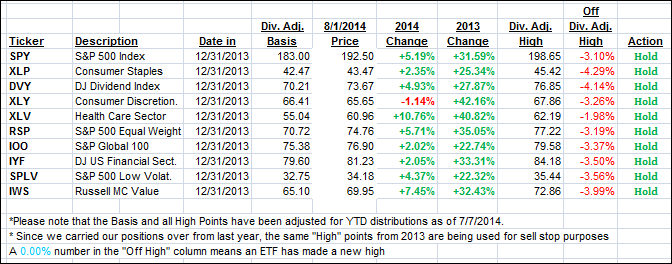
Year to date, here’s how the above candidates have fared so far:

YTD

To be clear, the first table above shows the position of the various ETFs in relation to their respective long term trend lines (%M/A), while the second one tracks their trailing sell stops in the “Off High” column. The “Action” column will signal a “Sell” once the -7.5% point is taken out in the “Off High” column.

3. Domestic Trend Tracking Indexes (TTIs)

Our Trend Tracking Indexes (TTIs) headed towards their long-term trend lines as this week’s sell off took its toll. The change from last Friday’s close was quite dramatic but, for the time being, we are remaining on the bullish side by the following percentages:

Domestic TTI: +1.23% (last Friday +2.72%)

International TTI: +1.07% (last Friday +3.03%)

Have a nice weekend.

Ulli…

Disclosure: I am obliged to inform you that I, as well as advisory clients of mine, own some of these listed ETFs. Furthermore, they do not represent a specific investment recommendation for you, they merely show which ETFs from the universe I track are falling within the guidelines specified.

————————————————————-

READER Q & A FOR THE WEEK

All Reader Q & A’s are listed at our web site!
Check it out at:

http://www.successful-investment.com/q&a.php

A note from reader Chris:

Q: Ulli: Have you seen any benefit by an investor creating their own portfolio comprising of a mix of Value ETFs (Large, Mid, Small, Developed, Emerging) and then coupled with Momentum ETFs of similar types. The goal is that both types of Value & Momentum ETFs hopefully won’t necessarily correlate with each other depending what the market is doing and spread some of the risk around.

My other question: are Momentum ETFs similar to Growth ETFs regarding how their index formulas/algorithms are determined or are both completely different kinds of ETF strategies?

A: Chris: No, I have not heard about any reader attempting that. “Value” is such a vague definition. When markets rise or fall, “all” equities will follow that trend, the only difference is the degree of change. A good case in point would be yesterday’s (7/31/14) price action where SPY dropped 1.94%. Its low volatility cousin, SPLV, which some consider a value play, surrendered 1.87%. That is hardly non-correlation.

To me, it’s far more important that you employ an exit strategy that gets you out of the market before a major disaster strikes, such as the bear effects of 2000 and 2008. Trying to distinguish between a Momentum ETF and Growth ETF is nothing but an exercise in futility.

———————————————————-

WOULD YOU LIKE TO HAVE YOUR INVESTMENTS PROFESSIONALLY MANAGED?

Do you have the time to follow our investment plans yourself? If you are a busy professional who would like to have his portfolio managed using our methodology, please contact me directly or get more details at:

https://theetfbully.com/personal-investment-management/

———————————————————

Back issues of the ETF/No Load Fund Tracker are available on the web at:

https://theetfbully.com/newsletter-archives/