
ETF/No Load Fund Tracker Newsletter For August 1, 2014
ETF/No Load Fund Tracker StatSheet
————————————————————-
THE LINK TO OUR CURRENT ETF/MUTUAL FUND STATSHEET IS:
————————————————————
Market Commentary
Friday, August 1, 2014
STOCKS END THE WEEK ON A SOUR NOTE AMIDST ARGENTINEAN DEBT CONCERNS
1. Moving the Markets
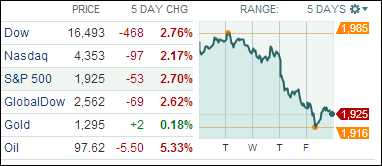
U.S. stocks fell for a second day Friday, adding to the massive sell-off the day before and giving the market its worst week in two years. The S&P 500 fell 53 points to 1,925, down 2.63%. The Dow Jones Industrial Average fell 468 points to end the week at 16,493, down 2.8%, and the Nasdaq dropped 2.17%.
Argentina captured headlines today when it was announced that the country defaulted on its debt, raising fears among skittish investors already fretting about corporate earnings growth, rising interest rates, global conflict and an aging bull market.
Energy and financial stocks were among the biggest decliners. Chevron (CHEV), the nation’s second-largest oil and gas company behind Exxon Mobil (XOM), fell $1.34, or 1%, to $127.90. While Chevron’s earnings were better than analysts had predicted, the company’s oil and gas production fell in the quarter.
Investors did get some good news about the U.S. economy though today. The Labor Department said that U.S. employers created 209,000 jobs in July, while the unemployment rate rose to 6.2% from 6.1%. July was the sixth-straight month that U.S. employers created more than 200,000 jobs, a sign that the U.S. economy continues to recover. Economists also pointed out that the rise in the unemployment rate was likely due to more out-of-work people actively looking for jobs.
Our 10 ETFs in the Spotlight ended up mixed today with 4 of them gaining and 6 of them losing; no new highs were made but 1 ETF slipped into the red YTD.
2. ETFs in the Spotlight
In case you missed the announcement and description of this section, you can read it here again.
It features 10 broadly diversified ETFs from my HighVolume list as posted every Monday. Furthermore, they are screened for the lowest MaxDD% number meaning they have been showing better resistance to temporary sell offs than all others over the past year.
Here are the 10 candidates:
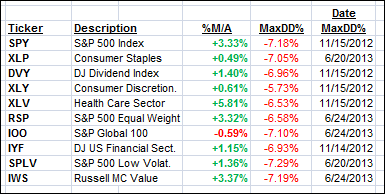
9 of them are in “buy” mode, meaning their prices are above their respective long term trend lines by the percentage indicated (%M/A).
Year to date, here’s how the above candidates have fared so far:
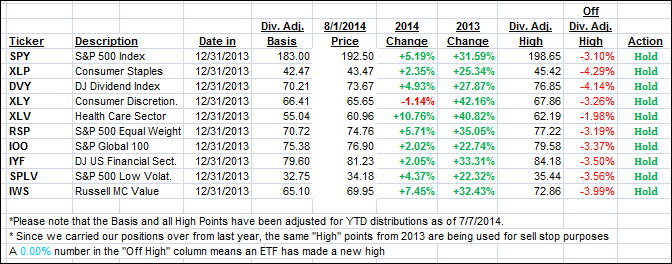
To be clear, the first table above shows the position of the various ETFs in relation to their respective long term trend lines (%M/A), while the second one tracks their trailing sell stops in the “Off High” column. The “Action” column will signal a “Sell” once the -7.5% point is taken out in the “Off High” column.
3. Domestic Trend Tracking Indexes (TTIs)
Our Trend Tracking Indexes (TTIs) headed towards their long-term trend lines as this week’s sell off took its toll. The change from last Friday’s close was quite dramatic but, for the time being, we are remaining on the bullish side by the following percentages:
Domestic TTI: +1.23% (last Friday +2.72%)
International TTI: +1.07% (last Friday +3.03%)
Have a nice weekend.
Ulli…
Disclosure: I am obliged to inform you that I, as well as advisory clients of mine, own some of these listed ETFs. Furthermore, they do not represent a specific investment recommendation for you, they merely show which ETFs from the universe I track are falling within the guidelines specified.
————————————————————-
READER Q & A FOR THE WEEK
All Reader Q & A’s are listed at our web site!
Check it out at:
http://www.successful-investment.com/q&a.php
A note from reader Chris:
Q: Ulli: Have you seen any benefit by an investor creating their own portfolio comprising of a mix of Value ETFs (Large, Mid, Small, Developed, Emerging) and then coupled with Momentum ETFs of similar types. The goal is that both types of Value & Momentum ETFs hopefully won’t necessarily correlate with each other depending what the market is doing and spread some of the risk around.
My other question: are Momentum ETFs similar to Growth ETFs regarding how their index formulas/algorithms are determined or are both completely different kinds of ETF strategies?
A: Chris: No, I have not heard about any reader attempting that. “Value” is such a vague definition. When markets rise or fall, “all” equities will follow that trend, the only difference is the degree of change. A good case in point would be yesterday’s (7/31/14) price action where SPY dropped 1.94%. Its low volatility cousin, SPLV, which some consider a value play, surrendered 1.87%. That is hardly non-correlation.
To me, it’s far more important that you employ an exit strategy that gets you out of the market before a major disaster strikes, such as the bear effects of 2000 and 2008. Trying to distinguish between a Momentum ETF and Growth ETF is nothing but an exercise in futility.
———————————————————-
WOULD YOU LIKE TO HAVE YOUR INVESTMENTS PROFESSIONALLY MANAGED?
Do you have the time to follow our investment plans yourself? If you are a busy professional who would like to have his portfolio managed using our methodology, please contact me directly or get more details at:
https://theetfbully.com/personal-investment-management/
———————————————————
Back issues of the ETF/No Load Fund Tracker are available on the web at:
https://theetfbully.com/newsletter-archives/
Contact Ulli