
1. Moving The Markets
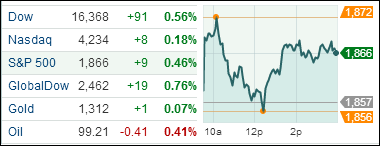
Equities bounced back today from a previous two day decline. Investors reacted well to a favorable reading on consumer confidence that showed positive signs of growth for the U.S. economy. All of the major indexes gained as the chart above shows. Additionally, nine of the ten industry groups in the S&P 500 ended the day higher. Industrial stocks rose the most, 0.9%, followed by the energy and health care sectors, which each gained 0.8%.
In tech news, Facebook (FB) announced today that it has agreed to buy Oculus, a virtual reality technology company, for $2 billion. Facebook Inc. said that the deal includes $400 million in cash and 23.1 million shares worth about $1.6 billion. Facebook’s stock ended the day up 1.23%. Oculus employees are also eligible for an additional $300 million if the company achieves certain targets. Oculus makes the Oculus Rift, a virtual reality headset that’s received a lot of attention from video game developers, though it’s yet to be released.
The market has been alternating between gains and losses for the most of the month, with investors buying back stocks after every dip. While some are confident that economic growth will accelerate following an unusually harsh winter, others are reluctant to push stock prices too much higher before seeing more clear-cut evidence that the economy is picking up. To avoid not having to play the guessing game, we will simply continue to follow the long-term trends; after all, they appear to be the only true measure as to the direction of equities.
While the consumer confidence report was favorable, I also heard today that fewer people bought new homes in February and that home sales fell to the slowest pace in five months.
Our 10 ETFs in the Spotlight headed north with 7 of them remaining on the plus side YTD.
2. ETFs in the Spotlight
In case you missed the announcement and description of this section, you can read it here again.
It features 10 broadly diversified ETFs from my HighVolume list as posted every Monday. Furthermore, they are screened for the lowest MaxDD% number meaning they have been showing better resistance to temporary sell offs than all others over the past year.
In other words, none of them ever triggered their 7.5% sell stop level during this time period, which included a variety of severe market pullbacks but no move into outright bear market territory.
Here are the 10 candidates:
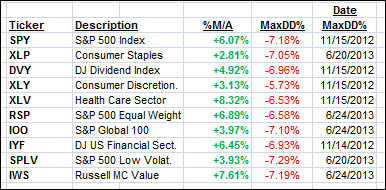
All of them are in “buy” mode meaning their prices are above their respective long term trend lines by the percentage indicated (%M/A).
Year to date, here’s how the above candidates have fared so far:
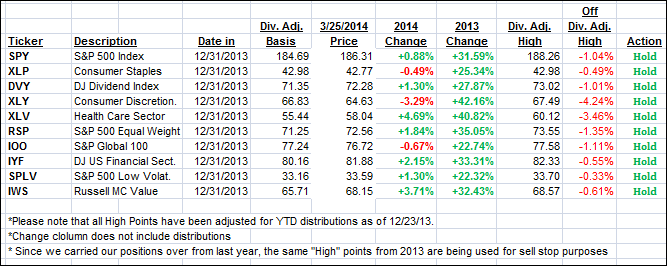
To be clear, the first table above shows the position of the various ETFs in relation to their respective long term trend lines (%M/A), while the second one tracks their trailing sell stops in the “Off High” column.
3. Domestic Trend Tracking Indexes (TTIs)
Our Trend Tracking Indexes (TTIs) bounced back from yesterday’s sell off and closed as follows:
Domestic TTI: +3.05% (last close +2.87%)
International TTI: +3.13% (last close +2.61%)
Disclosure: I am obliged to inform you that I, as well as advisory clients of mine, own some of these listed ETFs. Furthermore, they do not represent a specific investment recommendation for you, they merely show which ETFs from the universe I track are falling within the guidelines specified.
Contact Ulli