
1. Moving The Markets
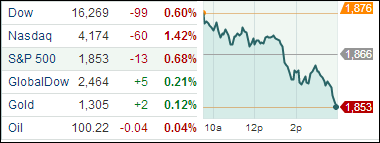
The markets continued their predictable pattern of being inconsistent today. After starting the day higher following an encouraging report on orders for manufactured goods, stocks drifted lower in afternoon trading Wednesday and gave up their gains from a day earlier. Facebook (FB) led the technology sector lower as investors gave the company’s latest acquisition the thumbs-down. The S&P 500 index fell the most in two weeks and is now flat for the year.
Healthcare was the only industry sector to rise today. Tenet Healthcare (THC) rose 5.2% to $40.93 and Quest Diagnostic (DGX) rose 5.6% to $57.99. Many analysts are saying that hospitals and medical device companies are attractive because they have steady revenue streams.
In banking, Citigroup (C) fell 5.3% to $47.50 in after-hours trading after the Federal Reserve turned down the bank’s plan to spend $6.4 billion buying back its own stock and increasing its quarterly dividend from 1 cent to 5 cents.
The United States and the European Union agreed to work together to prepare possible tougher economic sanctions in response to Russia’s behavior in Ukraine. The sanctions could possibly include the energy sector. And thus, the S&P energy sector index (^SPNY) slipped 0.3% today.
Our 10 ETFs in the Spotlight followed the trend of the indexes; however, 7 of them are remaining on the plus side YTD.
2. ETFs in the Spotlight
In case you missed the announcement and description of this section, you can read it here again.
It features 10 broadly diversified ETFs from my HighVolume list as posted every Monday. Furthermore, they are screened for the lowest MaxDD% number meaning they have been showing better resistance to temporary sell offs than all others over the past year.
In other words, none of them ever triggered their 7.5% sell stop level during this time period, which included a variety of severe market pullbacks but no move into outright bear market territory.
Here are the 10 candidates:
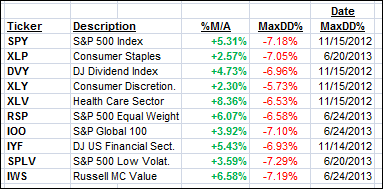
All of them are in “buy” mode meaning their prices are above their respective long term trend lines by the percentage indicated (%M/A).
Year to date, here’s how the above candidates have fared so far:
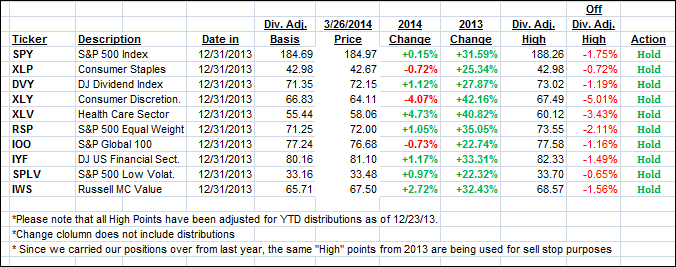
To be clear, the first table above shows the position of the various ETFs in relation to their respective long term trend lines (%M/A), while the second one tracks their trailing sell stops in the “Off High” column.
3. Domestic Trend Tracking Indexes (TTIs)
Our Trend Tracking Indexes (TTIs) gave back yesterday’s gains:
Domestic TTI: +2.67% (last close +3.05%)
International TTI: +3.07% (last close +3.13%)
Disclosure: I am obliged to inform you that I, as well as advisory clients of mine, own some of these listed ETFs. Furthermore, they do not represent a specific investment recommendation for you, they merely show which ETFs from the universe I track are falling within the guidelines specified.
Contact Ulli