ETF/No Load Fund Tracker Newsletter For July 25, 2014
ETF/No Load Fund Tracker StatSheet
————————————————————-
THE LINK TO OUR CURRENT ETF/MUTUAL FUND STATSHEET IS:
https://theetfbully.com/2014/07/weekly-statsheet-for-the-etfno-load-fund-tracker-newsletter-updated-through-07242014/
————————————————————
Market Commentary
Friday, July 25, 2014
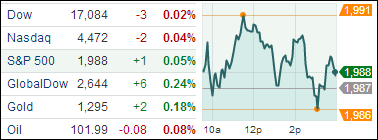
UP AND DOWN WAS THE NAME OF THE GAME FOR MARKETS THIS WEEK
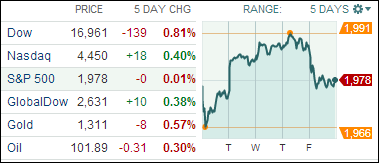
[Chart courtesy of MarketWatch.com]
1. Moving the Markets
Stocks were relatively flat on the week and moved up and down amidst a combination of positive global economic readings, but mixed earnings announcements from many large U.S. companies. The S&P 500 touched a new all-time high midweek, the 27th record close so far this year, and the index is up 8.52%.
Earnings announcements from Visa (V), Pandora (P) and Amazon (AMZN), Boeing (BA) and Caterpillar (CAT) were notable disappointments that were a drag on the market.
On the economic front, initial jobless claims for unemployment benefits fell 19,000 to 284,000, the lowest level since February 2006, which is very encouraging. Housing data was mixed, however. New home sales fell 8.1% in June from May to a 406,000 unit annual rate, completely reversing the strong increase in May.
In the week ahead, a full slate of economic reports along with another round of second-quarter earnings announcements will give investors a lot to digest. The July employment report should steal headlines, with expectations for 230,000 jobs to have been created in the month. The first read on U.S. second-quarter GDP growth should also draw attention, giving the markets a look at just how much the economy recovered after the cold, snowy and weak first quarter.
Our 10 ETFs in the Spotlight slipped today and no new highs were made. I have included a chart for all 10 of them for quick reference. Take a look below:
2. ETFs in the Spotlight
In case you missed the announcement and description of this section, you can read it here again.
It features 10 broadly diversified ETFs from my HighVolume list as posted every Monday. Furthermore, they are screened for the lowest MaxDD% number meaning they have been showing better resistance to temporary sell offs than all others over the past year.
Here are the 10 candidates:
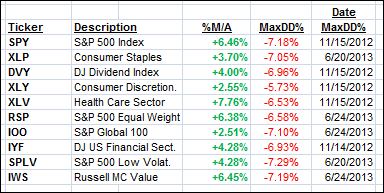
All of them are in “buy” mode, meaning their prices are above their respective long term trend lines by the percentage indicated (%M/A).
Year to date, here’s how the above candidates have fared so far:
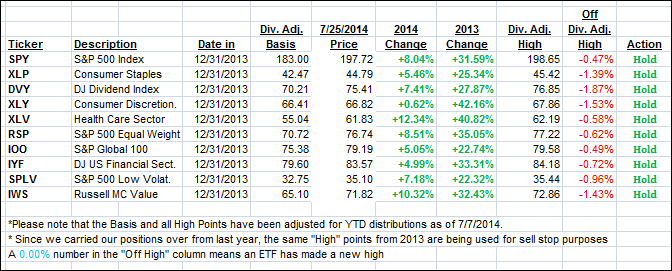
To be clear, the first table above shows the position of the various ETFs in relation to their respective long term trend lines (%M/A), while the second one tracks their trailing sell stops in the “Off High” column. The “Action” column will signal a “Sell” once the -7.5% point is taken out in the “Off High” column.
And for a quick visual review, below are the charts for all of 10 them. Courtesy of VinViz.com:
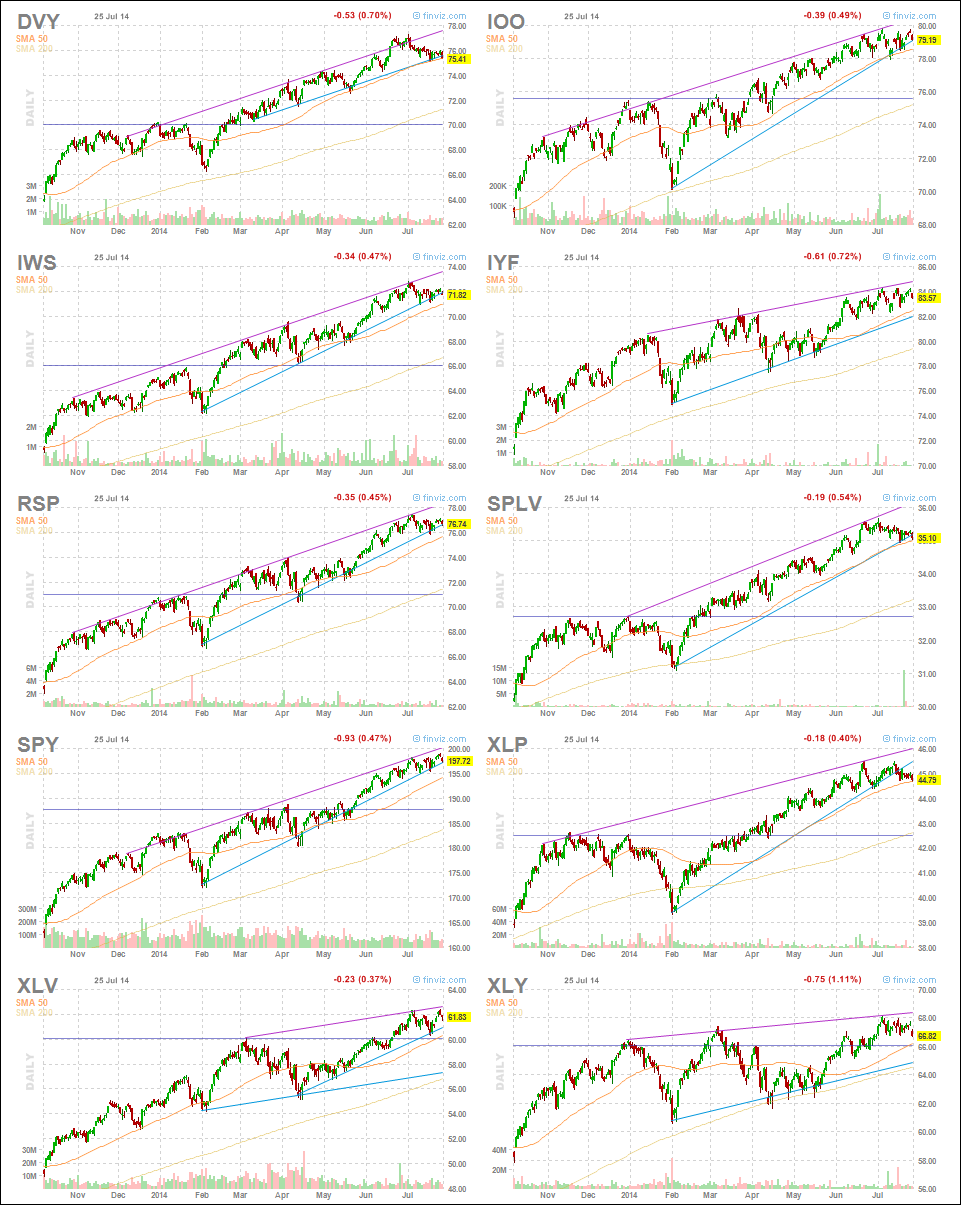 Click on chart to enlarge
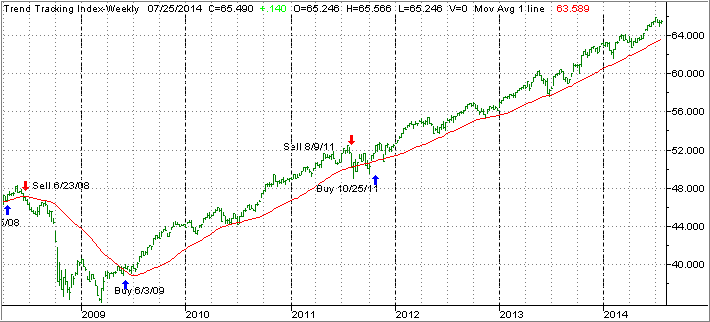
3. Domestic Trend Tracking Indexes (TTIs)
Our Trend Tracking Indexes (TTIs) hardly changed as the S&P meandered and closed just about even with last Friday:
Domestic TTI: +2.72% (last Friday +2.90%)
International TTI: +3.03% (last Friday +3.35%)
Have a nice weekend.
Ulli…
Disclosure: I am obliged to inform you that I, as well as advisory clients of mine, own some of these listed ETFs. Furthermore, they do not represent a specific investment recommendation for you, they merely show which ETFs from the universe I track are falling within the guidelines specified.
————————————————————-
READER Q & A FOR THE WEEK
All Reader Q & A’s are listed at our web site!
Check it out at:
http://www.successful-investment.com/q&a.php
A note from reader Tarantola:
Q: Ulli: The performance of the ETFs in the Spotlight is impressive. Do you have any suggestion on how some or all of them might be included in a portfolio? Or could they form a portfolio in themselves?
A: Tarentola: I can’t give direct advice, since I don’t know your circumstances. You should make your selections based on your risk tolerance. Sure, you could use all of them, if you have a larger portfolio or just some of them.
As a general observation, most investors diversify too much. For example, for a $500k portfolio, I have used as few as 4 ETFs. Whatever your mode of operation, be sure to use my recommended sell stop discipline.
———————————————————-
WOULD YOU LIKE TO HAVE YOUR INVESTMENTS PROFESSIONALLY MANAGED?
Do you have the time to follow our investment plans yourself? If you are a busy professional who would like to have his portfolio managed using our methodology, please contact me directly or get more details at:
https://theetfbully.com/personal-investment-management/
———————————————————
Back issues of the ETF/No Load Fund Tracker are available on the web at:
https://theetfbully.com/newsletter-archives/