
1. Moving the Markets
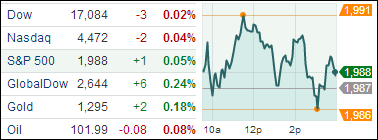
Major U.S. stock indexes ended roughly where they began Thursday, despite investors having to work through a busy day of corporate earnings and two economic reports. The S&P 500 inched out a 0.05% gain, while the Dow and Nasdaq lost 0.02% and 0.04% respectively.
Homebuilder stocks slid and dragged the market lower after the government reported that new home sales sagged 8.1 percent last month. On the flip side though, the Labor Department reported weekly applications for unemployment aid dropped 19,000 to a seasonally adjusted 284,000 claims. That’s the lowest reading since February 2006.
Corporate earnings announcements continued to roll in today and continued to be mostly positive, except for Amazon. Shares of Amazon (AMZN) plunged 10%, to $322.50, in after-hours trading when the company announced its wider-than-expected $126 million loss for Q2. Beyond the $126 million-loss, it said it expects to lose up to $810 million in the upcoming quarter — compared to a $25 million loss in the third quarter last year.
Our 10 ETFs in the Spotlight edged higher with 9 of them gaining and 3 of them making new highs.
2. ETFs in the Spotlight
In case you missed the announcement and description of this section, you can read it here again.
It features 10 broadly diversified ETFs from my HighVolume list as posted every Monday. Furthermore, they are screened for the lowest MaxDD% number meaning they have been showing better resistance to temporary sell offs than all others over the past year.
Here are the 10 candidates:
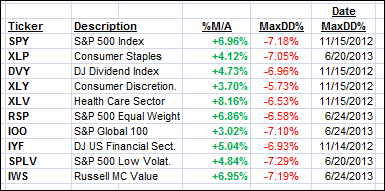
All of them are in “buy” mode, meaning their prices are above their respective long term trend lines by the percentage indicated (%M/A).
Year to date, here’s how the above candidates have fared so far:
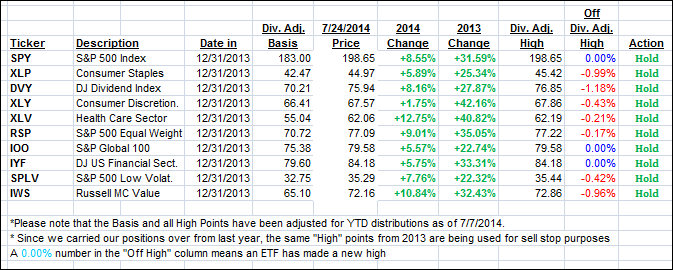
To be clear, the first table above shows the position of the various ETFs in relation to their respective long term trend lines (%M/A), while the second one tracks their trailing sell stops in the “Off High” column. The “Action” column will signal a “Sell” once the -7.5% point is taken out in the “Off High” column.
3. Domestic Trend Tracking Indexes (TTIs)
Our Trend Tracking Indexes (TTIs) slipped a tad and closed as follows:
Domestic TTI: +3.12% (last close +3.24%)
International TTI: +3.67% (last close +3.70%)
Disclosure: I am obliged to inform you that I, as well as advisory clients of mine, own some of these listed ETFs. Furthermore, they do not represent a specific investment recommendation for you, they merely show which ETFs from the universe I track are falling within the guidelines specified.
Contact Ulli