Due to a variety of Holiday obligations, I will not be able to write today’s newsletter. However, this week’s StatSheet has been published, and the weekend pieces will be posted as usual.
Hope you are enjoying this Holiday weekend.
Ulli…

Due to a variety of Holiday obligations, I will not be able to write today’s newsletter. However, this week’s StatSheet has been published, and the weekend pieces will be posted as usual.
Hope you are enjoying this Holiday weekend.
Ulli…
ETF/Mutual Fund Data updated through Wednesday, December 24, 2014
If you are not familiar with some of the terminology used, please see the Glossary of Terms.
1. DOMESTIC EQUITY MUTUAL FUNDS/ETFs: BUY — since 10/22/2014
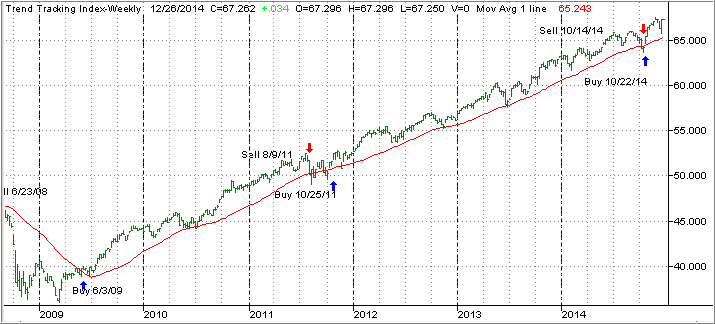
Our main directional indicator, the Domestic Trend Tracking Index (TTI), broke through its long-term trend line generating a “Sell” for this arena effective 10/14/2014, which was followed by a violent break back above the line on 10/22/14 generating a new “Buy.” It was a classic whipsaw signal, and you can read more on my blog as to the events as they were unfolding.
As of today, our TTI (green line in above chart) is positioned above its long term trend line (red) by +3.26% keeping us in the market with newly established positions.
1. Moving the Markets
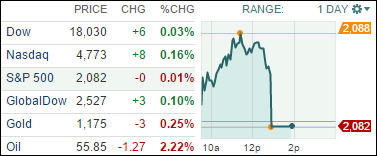
It was nice start to a continuation of the current upward momentum but, while the S&P 500 fell back later on, the Dow managed its 37th record close of 2014.
It was a Holiday shortened session on extreme light volume, so not much should be read into today’s action. Helping the indexes was a steeper than expected drop in weekly jobless claims following the recent surprisingly strong GDP report, which received a boost due to seasonal adjustments.
4 of our 10 ETFs in the Spotlight closed up with 2 of them making new highs as table 3 below shows.
1.Moving the Markets
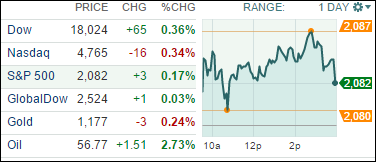
Markets continued their rally today following news reports of continued economic growth and the strongest consumer sentiment we have seen since 2007. The government released numbers today that showed GDP expanded at a seasonally adjusted annual rate of 5% for the three months ended September 30th. The S&P 500 gained 0.2%, the Dow rose 0.4% (closing at 18,024.17 a record), however, the Nasdaq dropped 0.3%. Markets continue to rock and roll through the Holiday season and aren’t showing signs of reversing the trend heading into 2015.
Part of continued economic growth can likely be attributed to gas prices remaining low, as they continue to fall at the pump. You may be shocked to know that the price of gas has actually fallen for 89 consecutive days now! This is the longest streak on record according to AAA. For the first time in five years, prices are now as low as $2.38 a gallon.
In corporate news, investors in Keurig Green Mountain Inc didn’t have much to be happy about today. The company announced it is recalling about 7.2 million home brewing machines because they could overheat and be hazardous to users. Shares fell 2.2% after the news. Keurig has received about 200 reports of hot liquid escaping from the brewer, including 90 reports of burn related injuries, the U.S. Consumer Product Safety Commission said.
Let’s hope that consumer spending throughout the rest of the Holiday season and low oil prices will continue to drive markets higher to close out the year.
9 of our 10 ETFs in the Spotlight rallied with 7 of them making new highs in the process as table 3 below shows.
1. Moving the Markets
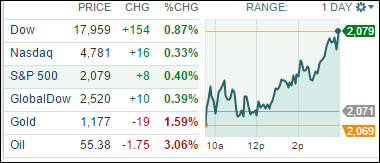
Despite a slow start, the major indexes picked up steam during mid-day with the Dow and S&P 500 closing at record levels—again. The theme that the Fed won’t be raising rates at anytime soon proved to be the driver for today’s session.
This was the fourth straight day of gains, since Fed chair Yellen uttered Wall Street’s favorite word in regards to the timing and speed of any rate hikes, namely “patience.” Let’s see how long this word works its magic before it needs to be replaced by a new one.
Economic data were mixed with existing home sales taking a beating during November, as they slowed down to their weakest pace in 6 months. Offsetting this negative was a report on economic growth from the Chicago Fed that was stronger than expected.
9 of our 10 ETFs in the Spotlight participated in the upward momentum and closed up; 5 of them made new highs as table 3 below shows.
Below are the latest ETF Cutline reports, which show how far above or below their respective long-term trend lines (39 week SMA) my currently tracked ETFs/MFs are positioned.
The first report covers the ETF Master List from Thursday’s StatSheet and includes 410 ETFs, of which currently 248 (last week 222) are hovering in bullish territory.
The second report includes only High Volume ETFs. To clarify, High Volume (HV) ETFs are defined as those with an average daily volume of $10 million or higher.
These ETFs are generated from my selected list of some 97 that I use in my advisor practice. It cuts out the “noise,” which simply means it eliminates those ETFs that I would never buy because of their volume limitations. 35 ETFs (last week 32) have managed to remain in bullish territory after the recent market volatility.
The third report covers Mutual Funds on the Cutline. There are currently 418 (last week 440) above the line and 428 below it out of the 846 that I follow.
Take a look:
2. ETF High Volume Cutline Report
In case you are not familiar with some of the terminology used in the reports, please read the Glossary of Terms.
If you missed the original post about the Cutline approach, you can read it here.