ETF/No Load Fund Tracker Newsletter For October 10, 2014
ETF/No Load Fund Tracker StatSheet
————————————————————-
THE LINK TO OUR CURRENT ETF/MUTUAL FUND STATSHEET IS:
————————————————————
Market Commentary
Friday, October 10, 2014
A VOLATILE WEEK—DOMESTIC TTI SLIPS INTO BEAR MARKET TERRITORY
1. Moving the Markets
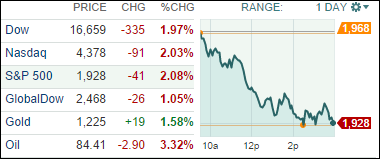
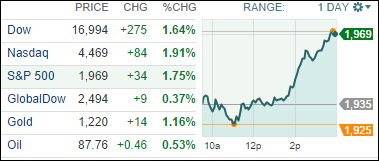
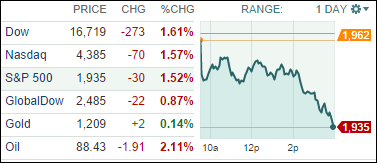
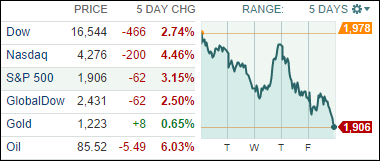
Well, here we are winding down one of the most volatile weeks we have seen since January. Equities are at a seven-month low and oil is at a four-year low. All of the major indexes dropped as the above 5-day chart shows. October has already achieved the “most volatile month for stocks” title since June 2013, with five daily up or down movements of 1% or more.
Despite a range of incoming data that signal the U.S. economy is improving, investors have grown increasingly concerned about growth in the rest of the world, particularly in Europe and China. One of the biggest shocks to the markets this week was the IMF’s adjustment to its global economic growth forecast down to 3.3%, which marks its fourth downward adjustment this year.
In tech, we heard this week that Samsung Electronics, the global leader in Smartphone sales, estimated a drop in Q3 operating profit of more than 50% from a year earlier. The mobile division’s profit is being severely curtailed on the low end by tough competition from Chinese vendors. On the high end, Apple’s popular new large-screen iPhone 6 Plus has reduced consumer appetite for Samsung’s flagship Galaxy S5, forcing the firm to cut product prices and spend more on marketing.
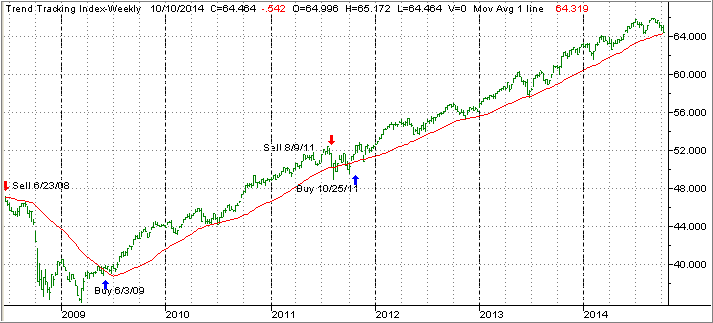
In regards to trend direction, our Domestic TTI just slipped below its long-term trend line and into bearish territory. Please section 3 below for more details.
Let’s look to next week to (hopefully) see some reduction in volatility as corporate earnings announcements get further under way.
9 of our 10 ETFs in the Spotlight slid with the indexes, one bucked the trend and one triggered its trailing sell stop as you can see in the YTD table below.
2. ETFs in the Spotlight
In case you missed the announcement and description of this section, you can read it here again.
It features 10 broadly diversified ETFs from my HighVolume list as posted every Monday. Furthermore, they are screened for the lowest MaxDD% number meaning they have been showing better resistance to temporary sell offs than all others over the past year.
Here are the 10 candidates:
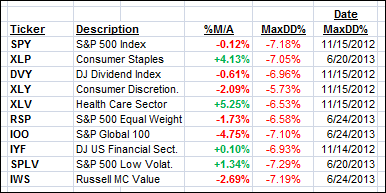
All of them, except IOO, SPY, DVY, XLY, RSP, IWS, are currently in “buy” mode, meaning their prices are above their respective long term trend lines by the percentage indicated (%M/A).
Year to date, here’s how the above candidates have fared so far:
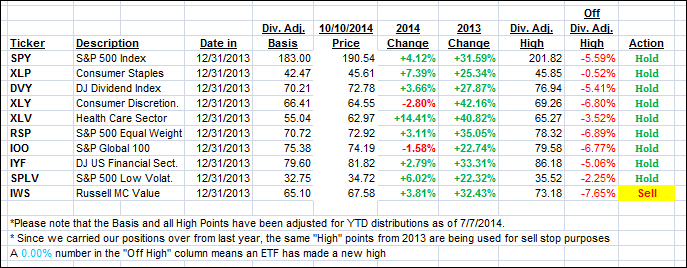
To be clear, the first table above shows the position of the various ETFs in relation to their respective long term trend lines (%M/A), while the second one tracks their trailing sell stops in the “Off High” column. The “Action” column will signal a “Sell” once the -7.5% point is taken out in the “Off High” column.
3. Domestic Trend Tracking Indexes (TTIs)
Our Trend Tracking Indexes (TTIs) followed the weak market tendencies, and the Domestic one joined its international cousin in bear market territory as of today. Since the drop below the line was fairly small, I will wait for a day or two to see if there is a rebound in the making in order to avoid a potential whip-saw signal.
If, however, the Domestic TTI slips lower, I will declare this Buy cycle, which started on 10/25/2011, to be over. That means we will exit our “broadly diversified domestic equity mutual fund/ETF” positions and move to the safety of our money market accounts for the time being. I will then evaluate and see if other investment opportunities exist; however, safety is first, since in my view the downside risk may be along the lines of what we’ve seen in 2008, or worse. Stay tuned for any updates.
Domestic TTI: -0.39% (last Friday +1.11%)
International TTI: -4.81% (last Friday -2.08%)—Sell signal since 10/1/2014
Have a nice weekend.
Ulli…
Disclosure: I am obliged to inform you that I, as well as advisory clients of mine, own some of these listed ETFs. Furthermore, they do not represent a specific investment recommendation for you, they merely show which ETFs from the universe I track are falling within the guidelines specified.
————————————————————-
READER Q & A FOR THE WEEK
All Reader Q & A’s are listed at our web site!
Check it out at:
http://www.successful-investment.com/q&a.php
Reader Steve:
Q: Ulli: I was reading through the “how to beat the S&P using the S&P and was thinking about capital gains. They wouldn’t be an issue in a 401K but could impact a standard investment account?
On the surface, I’m guessing that missing the downswings would far outweigh any tax consequences on the gains at sale?
Thanks for all the newsletters and commentary. I appreciate that you share your insights.
A: Steve: Yes, I believe that avoiding the big drops is a far more important issue than tax consequences.
In my view, tax issues are secondary while protection and preservation of capital should always be the primary goal. Those that have experienced the bear markets of 2000 and 2008 can certainly attest to that.
———————————————————-
WOULD YOU LIKE TO HAVE YOUR INVESTMENTS PROFESSIONALLY MANAGED?
Do you have the time to follow our investment plans yourself? If you are a busy professional who would like to have his portfolio managed using our methodology, please contact me directly or get more details at:
https://theetfbully.com/personal-investment-management/
———————————————————
Back issues of the ETF/No Load Fund Tracker are available on the web at: