03-06-2015

Ulli Newsletter Archives Contact

ETF/No Load Fund Tracker Newsletter For March 6, 2015

ETF/No Load Fund Tracker StatSheet

————————————————————-

THE LINK TO OUR CURRENT ETF/MUTUAL FUND STATSHEET IS:

https://theetfbully.com/2015/03/weekly-statsheet-for-the-etfno-load-fund-tracker-newsletter-updated-through-03052015/

————————————————————

Market Commentary

Friday, March 6, 2015

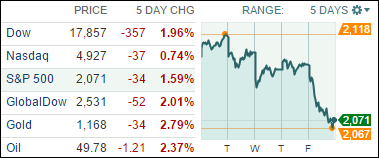
STOCKS CLOSE THE WEEK ON A DOWN NOTE

Fri pic

[Chart courtesy of MarketWatch.com]

1. Moving the Markets

U.S. stocks fell sharply today as better-than-forecasted jobs data fueled anticipation that the Federal Reserve is moving closer to raising interest rates. Stocks have had an eventful week. On Monday, the Nasdaq composite closed above the 5000 barrier for the first time in 15 years and the Dow Jones industrial average and Standard & Poor’s 500 stock index notched fresh all-time closing highs. Yesterday, both the Dow and S&P 500 rose, ending a brief two-day losing streak.

Economic data for the week was mixed overall, with Friday’s stronger-than-expected employment report prompting market volatility to pick up at the close the week. Data continues to point toward growth of 2.5% to 3% for 2015 in the U.S., which is a stronger pace than most developed economies around the globe—that is if your believe in those forecasts.

Looking forward to the next week, fewer major economic releases are expected. February retail sales numbers on Thursday and the producer price index and University of Michigan sentiment reports on Friday are likely to headline the week on the economic front.

All of our 10 ETFs in the Spotlight succumbed to the bearish forces and closed down with 7 of them holding on to YTD gains as the table in section 2 shows.

2. ETFs in the Spotlight

In case you missed the announcement and description of this section, you can read it here again.

It features 10 broadly diversified ETFs from my HighVolume list as posted every Monday. Furthermore, they are screened for the lowest MaxDD% number meaning they have been showing better resistance to temporary sell offs than all others over the past year.

Here are the 10 candidates:

MaxDD

The above table simply demonstrates the magnitude with which some of the ETFs are fluctuating in regards to their positions above or below their respective individual trend lines (%M/A). A break below, represented by a negative number, shows weakness, while a break above, represented by a positive percentage, shows strength.

For hundreds of ETF/Mutual fund choices, be sure to reference Thursday’s StatSheet.

Year to date, here’s how the above candidates have fared so far:

YTD

Again, the first table above shows the position of the various ETFs in relation to their respective long term trend lines (%M/A), while the second one tracks their trailing sell stops in the “Off High” column. The “Action” column will signal a “Sell” once the -7.5% point has been taken out in the “Off High” column.

3. Trend Tracking Indexes (TTIs)

Our Trend Tracking Indexes (TTIs) took a dive from last Friday’s close but remain on the bullish side of their respective trend lines.

Here’s how we ended this week:

Domestic TTI: +2.74% (last Friday +3.84%)—Buy signal effective 10/22/2014

International TTI: +2.98% (last Friday +3.76%)—Buy signal effective 2/13/2015

Have a nice weekend.

Ulli…

Disclosure: I am obliged to inform you that I, as well as advisory clients of mine, own some of these listed ETFs. Furthermore, they do not represent a specific investment recommendation for you, they merely show which ETFs from the universe I track are falling within the guidelines specified.

————————————————————-

READER Q & A FOR THE WEEK

All Reader Q & A’s are listed at our web site!
Check it out at:

http://www.successful-investment.com/q&a.php

Reader Ed:

Q: Ulli: In looking at the data you have for the ETFS/Funds, what would be the best way to use the data to come up with potential ETF/Fund buys or conversely sells.

I’m not asking for a recommendation, just the process used to pick the best ETF’s/Funds listed. I mostly use Vanguard ETF’s and funds. If you think I should try other fund families, can you tell me the process to find the best ones?

I don’t like funds with high fees or restrictions in trading, although I don’t do that much, other than to balance my holdings. I’d very much the input you can provide.

A: Ed: While there are many ways to use the ETF/MF tables, I personally prefer to select a mix of funds, preference being ETFs, which demonstrate good upward momentum yet have shown historically some decent resistance to market pullbacks.

You can do that by dropping down the ranking list from the top a few spots, which would eliminate those high performers that tend to collapse quickly during corrections. Our goal is to remain invested as long as possible during up trends while minimizing any potential whip-saw signals.

To make it even easier, I selected 10 ETFs in the Spotlight, which are featured and updated in my daily market commentary. They were chosen based on performance and above average resistance to sell offs along with the fact that they are all trading in high volume. Times change and ETF performance rotates, but you can select from that list and/or find the equivalent at Vanguard, if you prefer.

Hope that helps.

———————————————————-

WOULD YOU LIKE TO HAVE YOUR INVESTMENTS PROFESSIONALLY MANAGED?

Do you have the time to follow our investment plans yourself? If you are a busy professional who would like to have his portfolio managed using our methodology, please contact me directly or get more details at:

https://theetfbully.com/personal-investment-management/

———————————————————

Back issues of the ETF/No Load Fund Tracker are available on the web at:
https://theetfbully.com/newsletter-archives/

ETF/No Load Fund Tracker Newsletter For March 6, 2015

Ulli Market Commentary Contact

ETF/No Load Fund Tracker StatSheet

————————————————————-

THE LINK TO OUR CURRENT ETF/MUTUAL FUND STATSHEET IS:

https://theetfbully.com/2015/03/weekly-statsheet-for-the-etfno-load-fund-tracker-newsletter-updated-through-03052015/

————————————————————

Market Commentary

Friday, March 6, 2015

STOCKS CLOSE THE WEEK ON A DOWN NOTE

Fri pic

[Chart courtesy of MarketWatch.com]

1. Moving the Markets

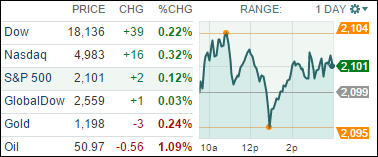
U.S. stocks fell sharply today as better-than-forecasted jobs data fueled anticipation that the Federal Reserve is moving closer to raising interest rates. Stocks have had an eventful week. On Monday, the Nasdaq composite closed above the 5000 barrier for the first time in 15 years and the Dow Jones industrial average and Standard & Poor’s 500 stock index notched fresh all-time closing highs. Yesterday, both the Dow and S&P 500 rose, ending a brief two-day losing streak.

Economic data for the week was mixed overall, with Friday’s stronger-than-expected employment report prompting market volatility to pick up at the close the week. Data continues to point toward growth of 2.5% to 3% for 2015 in the U.S., which is a stronger pace than most developed economies around the globe—that is if your believe in those forecasts.

Looking forward to the next week, fewer major economic releases are expected. February retail sales numbers on Thursday and the producer price index and University of Michigan sentiment reports on Friday are likely to headline the week on the economic front.

All of our 10 ETFs in the Spotlight succumbed to the bearish forces and closed down with 7 of them holding on to YTD gains as the table in section 2 shows.

Read More

Weekly StatSheet For The ETF/No Load Fund Tracker Newsletter – Updated Through 03/05/2015

Ulli ETF StatSheet Contact

ETF/Mutual Fund Data updated through Thursday, March 5, 2015

TOC021915

If you are not familiar with some of the terminology used, please see the Glossary of Terms.


1. DOMESTIC EQUITY MUTUAL FUNDS/ETFs: BUY — since 10/22/2014

TTI

Our main directional indicator, the Domestic Trend Tracking Index (TTI), broke through its long-term trend line generating a “Sell” for this arena effective 10/14/2014, which was followed by a violent break back above the line on 10/22/14 generating a new “Buy.” It was a classic whipsaw signal, and you can read more on my blog as to the events as they were unfolding.

As of today, our TTI (green line in above chart) is positioned above its long term trend line (red) by +3.73% keeping us in the market with our established positions.

Read More

Swinging Back Into Positive Territory

Ulli Market Commentary Contact

Thur pic

[Chart courtesy of MarketWatch.com]

1. Moving the Markets

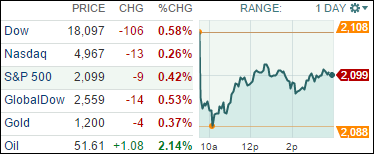
Major indexes broke their two day losing streak today. All of them closed in positive territory, pushed higher by updated news of the euro zone’s quantitative easing program.

The ECB will officially begin a 1 trillion euro bond-buying program on March 9th. President Mario Draghi indicated during a press conference today that he expects the mother of all stimulus programs to carry on through September of 2016. Following that comment, he also raised regional growth forecasts from for 2015 and 2016.

Costco (CSCO) was back in headlines today after announcing better than expected quarterly profits. The company said net income rose to $598 million for Q2. While they are going through some restructuring regarding their exclusive credit card agreement with American Express (AMEX), they continue to keep raking in profits regardless.

9 of our 10 ETFs in the Spotlight recovered and headed higher with SPLV taking the lead sporting a 0.63% gain. Trailing the bunch was IOO with a -0.18% loss. No new highs were made.

Read More

Indexes Pull Back

Ulli Market Commentary Contact

Wed pic

[Chart courtesy of MarketWatch.com]

1. Moving the Markets

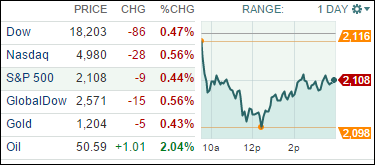
Wall Street this week is getting a mix of job-related data that will shed light on whether the stormy winter weather, West Coast port strike and continued troubles in the oil patch took a bite out of the U.S. job-creation machine in February. It is disappointing overall, given that all 3 major indexes were at record levels to start out the week.

In fast food news, McDonalds (MCD) made a move today that could influence the way chicken is produced and consumed in the U.S. The company said that over the next two years it will stop using chicken treated with antibiotics commonly used for humans. What’s the big deal you may ask? Well, antibiotic use with poultry, cattle and hogs has become a hot button issue with consumers. The result can be that germs become more drug resistant and, ultimately, the antibiotics can lose effectiveness in treating human illnesses.

In oil markets, Brent crude traded around $60 per barrel today after Saudi Arabia raised its official selling prices for its oil deliveries to Asia and the U.S. on Tuesday. In the past seven weeks, Brent crude has risen from a six-year low of around $45, despite global oversupply concerns.

9 of our 10 ETFs in the Spotlight slipped and closed lower. Bucking the trend was healthcare (XLV), which actually gained +0.48% despite the lack of upward momentum.

Read More

Equities Fall Led By Tech Stocks

Ulli Market Commentary Contact

Tue pic

[Chart courtesy of MarketWatch.com]

1. Moving the Markets

Just a day after the Nasdaq hit its highest mark in 15 years the markets turned downward. The S&P 500, Dow and Nasdaq all retreated from record highs.

We saw some great numbers come in for auto sales in the month of February. Apparently, big snowfall and freezing temperatures had little impact on the industry’s sales. Almost all major auto manufacturers reported gains, especially Toyota Motor (TM).

Best Buy (BBY) was back in the news today after reporting a revenue increase of 1.3% for the fourth quarter of 2014. Big screen TVs and mobile phones sales were particularly strong and were noted as the primary drivers of the company’s year-over-year revenue growth. Shares gained 1.2% in afternoon trading.

In M&A news, Springleaf Holdings said it will buy Citigroup’s OneMain Financial for $4.25 billion in cash. LEAF’s stock gained about 30% on the news.

In international news, keep an eye on China’s indexes. The country’s ceremonial legislature starts its annual session on Thursday and is expected to announce a growth target for 2015.

All of our 10 ETFs in the Spotlight headed south and closed lower with SPLV showing the most resistance towards today’s slide (-0.21%).

Read More