
1. Moving the Markets
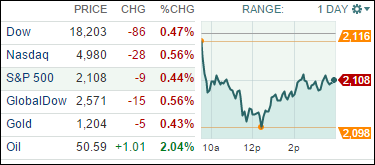
Just a day after the Nasdaq hit its highest mark in 15 years the markets turned downward. The S&P 500, Dow and Nasdaq all retreated from record highs.
We saw some great numbers come in for auto sales in the month of February. Apparently, big snowfall and freezing temperatures had little impact on the industry’s sales. Almost all major auto manufacturers reported gains, especially Toyota Motor (TM).
Best Buy (BBY) was back in the news today after reporting a revenue increase of 1.3% for the fourth quarter of 2014. Big screen TVs and mobile phones sales were particularly strong and were noted as the primary drivers of the company’s year-over-year revenue growth. Shares gained 1.2% in afternoon trading.
In M&A news, Springleaf Holdings said it will buy Citigroup’s OneMain Financial for $4.25 billion in cash. LEAF’s stock gained about 30% on the news.
In international news, keep an eye on China’s indexes. The country’s ceremonial legislature starts its annual session on Thursday and is expected to announce a growth target for 2015.
All of our 10 ETFs in the Spotlight headed south and closed lower with SPLV showing the most resistance towards today’s slide (-0.21%).
2. ETFs in the Spotlight
In case you missed the announcement and description of this section, you can read it here again.
It features 10 broadly diversified ETFs from my HighVolume list as posted every Monday. Furthermore, they are screened for the lowest MaxDD% number meaning they have been showing better resistance to temporary sell offs than all others over the past year.
Here are the 10 candidates:
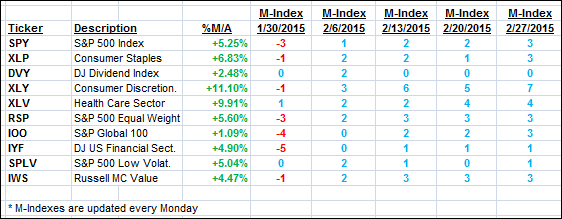
The above table simply demonstrates the magnitude with which some of the ETFs are fluctuating in regards to their positions above or below their respective individual trend lines (%M/A). A break below, represented by a negative number, shows weakness, while a break above, represented by a positive percentage, shows strength.
For hundreds of ETF/Mutual fund choices, be sure to reference Thursday’s StatSheet.
Year to date, here’s how the above candidates have fared so far:
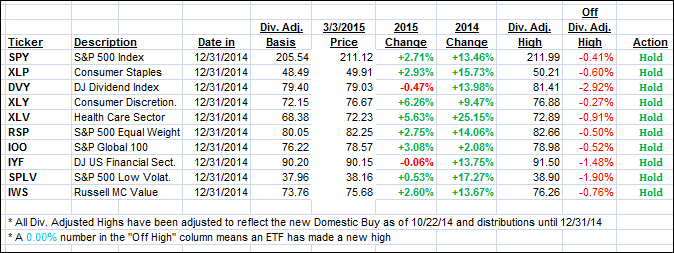
Again, the first table above shows the position of the various ETFs in relation to their respective long term trend lines (%M/A), while the second one tracks their trailing sell stops in the “Off High” column. The “Action” column will signal a “Sell” once the -7.5% point has been taken out in the “Off High” column.
3. Trend Tracking Indexes (TTIs)
Our Trend Tracking Indexes (TTIs) slipped with the International one taking a bigger fall; however, we solidly remain on the bullish side.
Here’s how we closed:
Domestic TTI: +3.78% (last close +4.10%)—Buy signal effective 10/22/2014
International TTI: +3.68% (last close +4.16%)—Buy signal effective 2/13/2015
Disclosure: I am obliged to inform you that I, as well as advisory clients of mine, own some of these listed ETFs. Furthermore, they do not represent a specific investment recommendation for you, they merely show which ETFs from the universe I track are falling within the guidelines specified.
Contact Ulli