
1. Moving the Markets
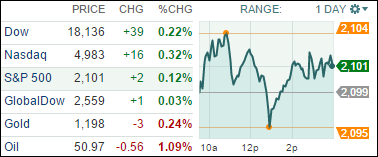
Major indexes broke their two day losing streak today. All of them closed in positive territory, pushed higher by updated news of the euro zone’s quantitative easing program.
The ECB will officially begin a 1 trillion euro bond-buying program on March 9th. President Mario Draghi indicated during a press conference today that he expects the mother of all stimulus programs to carry on through September of 2016. Following that comment, he also raised regional growth forecasts from for 2015 and 2016.
Costco (CSCO) was back in headlines today after announcing better than expected quarterly profits. The company said net income rose to $598 million for Q2. While they are going through some restructuring regarding their exclusive credit card agreement with American Express (AMEX), they continue to keep raking in profits regardless.
9 of our 10 ETFs in the Spotlight recovered and headed higher with SPLV taking the lead sporting a 0.63% gain. Trailing the bunch was IOO with a -0.18% loss. No new highs were made.
2. ETFs in the Spotlight
In case you missed the announcement and description of this section, you can read it here again.
It features 10 broadly diversified ETFs from my HighVolume list as posted every Monday. Furthermore, they are screened for the lowest MaxDD% number meaning they have been showing better resistance to temporary sell offs than all others over the past year.
Here are the 10 candidates:
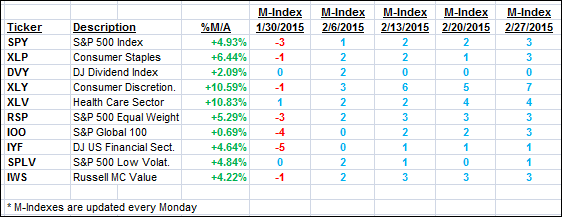
The above table simply demonstrates the magnitude with which some of the ETFs are fluctuating in regards to their positions above or below their respective individual trend lines (%M/A). A break below, represented by a negative number, shows weakness, while a break above, represented by a positive percentage, shows strength.
For hundreds of ETF/Mutual fund choices, be sure to reference Thursday’s StatSheet.
Year to date, here’s how the above candidates have fared so far:
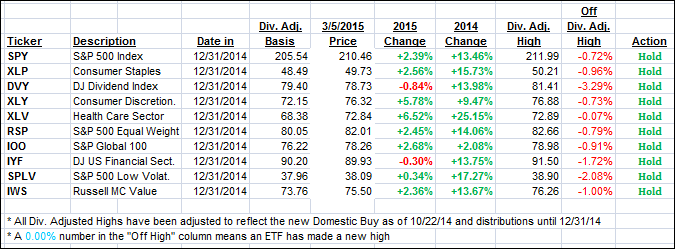
Again, the first table above shows the position of the various ETFs in relation to their respective long term trend lines (%M/A), along with their recent M-Indexes, while the second one tracks their trailing sell stops in the “Off High” column. The “Action” column will signal a “Sell” once the -7.5% point has been taken out in the “Off High” column.
3. Trend Tracking Indexes (TTIs)
Our Trend Tracking Indexes (TTIs) managed to eke out small gains, which moved their positions a little deeper into bullish territory.
Here’s how we closed:
Domestic TTI: +3.73% (last close +3.62%)—Buy signal effective 10/22/2014
International TTI: +3.86% (last close +3.57%)—Buy signal effective 2/13/2015
Disclosure: I am obliged to inform you that I, as well as advisory clients of mine, own some of these listed ETFs. Furthermore, they do not represent a specific investment recommendation for you, they merely show which ETFs from the universe I track are falling within the guidelines specified.
Contact Ulli