ETF/No Load Fund Tracker Newsletter For January 2, 2015

Ulli ETF Tracker Contact

ETF/No Load Fund Tracker StatSheet

————————————————————-

THE LINK TO OUR CURRENT ETF/MUTUAL FUND STATSHEET IS:

https://theetfbully.com/2014/12/weekly-statsheet-for-the-etfno-load-fund-tracker-newsletter-updated-through-12312014/

————————————————————

Market Commentary

Friday, January 2, 2015

SLIPPING AND SLIDING INTO THE NEW YEAR

Fri pic

[Chart courtesy of MarketWatch.com]

1. Moving the Markets

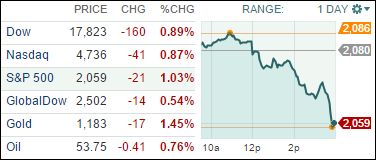
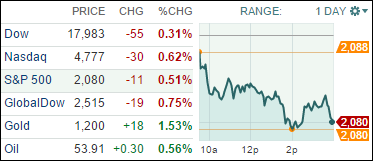
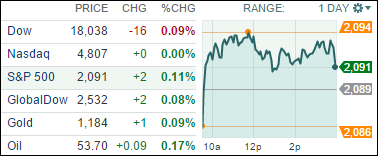
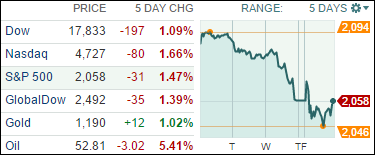
Stocks ended mixed in 2015’s first day of trading. The S&P 500 was down about 0.03%, the Nasdaq dropped 0.20%, while the Dow gained a slight 0.06%, however, the numbers were negative over the past week as the chart shows.

A mixed batch of economic data was likely the culprit that made markets stagger. Construction spending fell 0.3% for November, which was surprising to many analysts. Also, the growth in the U.S. manufacturing sector slipped to a 6-month low in December.

It seems fitting, as we start the New Year, to discuss one of the biggest market movers of 2014 – Oil. As you probably all know, oil “tanked” in the second half of 2014. The black gold dropped 46% for the year and is now at a 5 ½ year low.

The winners and losers relating to oil? Airlines and offshore drillers. Southwest Airlines (LUV) was the biggest gainer, soaring 124% last year. Transocrean (RIG) was the biggest loser sinking 63%.

It will be interesting to see how markets get back in swing for the first full week of trading next week. Let’s stay tuned.

5 of our 10 ETFs in the Spotlight managed to close up in today’s see-saw session but no new highs were made as section 3 shows.

Read More

Weekly StatSheet For The ETF/No Load Fund Tracker Newsletter – Updated Through 12/31/2014

Ulli ETF StatSheet Contact

ETF/Mutual Fund Data updated through Wednesday, December 31, 2014

TOC 121514

If you are not familiar with some of the terminology used, please see the Glossary of Terms.


1. DOMESTIC EQUITY MUTUAL FUNDS/ETFs: BUY — since 10/22/2014

TTI

Our main directional indicator, the Domestic Trend Tracking Index (TTI), broke through its long-term trend line generating a “Sell” for this arena effective 10/14/2014, which was followed by a violent break back above the line on 10/22/14 generating a new “Buy.” It was a classic whipsaw signal, and you can read more on my blog as to the events as they were unfolding.

As of today, our TTI (green line in above chart) is positioned above its long term trend line (red) by +2.85% keeping us in the market with newly established positions.

Read More

Major Indexes Drop As S&P 500 Turns Negative For The Month

Ulli Market Commentary Contact

WEd pic

[Chart courtesy of MarketWatch.com]

1. Moving the Markets

Equities slipped with the sell-off accelerating late in the day as volume dropped way below its three-month average. That is sure to change on Friday the first trading day of the New Year when we will be off to the races again.

There was no earthshaking news other than that applications for unemployment benefits rose for the first time in over a month, which was offset by a report showing that contracts to buy previously owned homes rose in November in part due to employment gains and continued low borrowing costs.

Oil remained on its slippery slope and is heading closer to breaking the $50 handle to the downside.

All of our 10 ETFs in the Spotlight headed south, as any upward momentum vanished during the last 30 minutes of the session.

Read More

Stocks Drop Before The New Year As Investors Secure 2014 Profits

Ulli Market Commentary Contact

Tue pic

[Chart courtesy of MarketWatch.com]

1. Moving the Markets

Stocks pulled back from record highs today as both the S&P 500 and Dow closed lower. Utilities, which have been 2014’s best performing sector, led the decline with a drop of 2.1%.

Perhaps investors are closing out a profitable year, given the fact that the Dow edged above 18,000 and the S&P 500 hit record closes more than 30 times. With one more trading day left in 2014, the S&P 500 is up 12.6% for the year, or up 15.4%, including dividends. That gain is almost double what stock market strategists expected at the beginning of the year.

Contradictory to falling stock prices, oil prices recovered slightly today as the benchmark U.S. crude rose 51 cents to settle at $54.12 a barrel in New York. This price point, as you may well know, is still one of the lowest we’ve seen in the past few years.

In the latest news on the economy, we heard today that consumer confidence numbers for December came in slightly less than expected, while U.S. single-family home price appreciation slowed less than was forecast in October.

Let’s stay poised to see what happens in the last day of trading for 2014!

All of our 10 ETFs in the Spotlight slipped as the major indexes slid into the close.

Read More

Markets Close Mixed On Light Trading; Oil At Lowest Price In 5 ½ Years

Ulli Market Commentary Contact

Mon pic

[Chart courtesy of MarketWatch.com]

1. Moving the Markets

Stocks ended mixed today; however, the S&P 500 once again reached a record high. That marks the 53rd record close this year. Now is not the time to be shy at the pump, because oil prices fell another 2% with crude for Friday delivery settling at $53.61 a barrel.

Speaking of oil, Russia was back in focus today. The ruble tumbled after the economy showed signs of recession due to falling oil prices and sanctions from western governments. The country’s GDP shrank 0.5% in November year-over-year and isn’t showing signs of a quick recovery.

In M&A news, Walgreens (WAG) investors were happy today to hear that shareholders approved the final phase of the company’s acquisition of Alliance Boots. Alliance Boots is a leading international, pharmacy-led health and beauty group delivering a range of products and services to customers. The transaction is a corporate reorganization that will result in Walgreens becoming a wholly owned subsidiary of a company to be known as Walgreens Boots Alliance. As part of the reorganization, Walgreens is shifting its stock listing from the New York and Chicago stock exchanges to the Nasdaq exchange.

Regarding upcoming news, the New Year will bring a shortened holiday week, with the markets closed on New Year’s Day. Most attention will be on the ISM manufacturing index, as well as construction spending.

8 of our 10 ETFs in the Spotlight closed up with 6 of them making new highs as table 3 below shows.

Read More

ETFs/Mutual Funds On The Cutline – Updated Through 12/26/2014

Ulli ETFs on the Cutline Contact

Below are the latest ETF Cutline reports, which show how far above or below their respective long-term trend lines (39 week SMA) my currently tracked ETFs/MFs are positioned.

The first report covers the ETF Master List from Thursday’s StatSheet and includes 410 ETFs, of which currently 251 (last week 248) are hovering in bullish territory.

The second report includes only High Volume ETFs. To clarify, High Volume (HV) ETFs are defined as those with an average daily volume of $10 million or higher.

These ETFs are generated from my selected list of some 97 that I use in my advisor practice. It cuts out the “noise,” which simply means it eliminates those ETFs that I would never buy because of their volume limitations. 35 ETFs (last week 35) have managed to remain in bullish territory after the recent market volatility.

The third report covers Mutual Funds on the Cutline. There are currently 422 (last week 418) above the line and 424 below it out of the 846 that I follow.

Take a look:

1. ETF Master Cutline Report

2. ETF High Volume Cutline Report

3. MF Cutline Report

In case you are not familiar with some of the terminology used in the reports, please read the Glossary of Terms.

If you missed the original post about the Cutline approach, you can read it here.