ETF/No Load Fund Tracker Newsletter For March 20, 2015
ETF/No Load Fund Tracker StatSheet
————————————————————-
THE LINK TO OUR CURRENT ETF/MUTUAL FUND STATSHEET IS:
https://theetfbully.com/2015/03/weekly-statsheet-for-the-etfno-load-fund-tracker-newsletter-updated-through-03192015/
————————————————————
Market Commentary
Friday, March 20, 2015
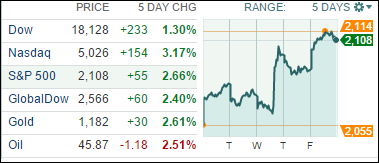
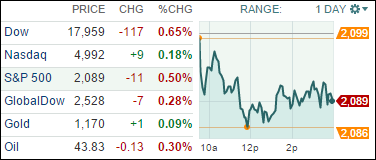
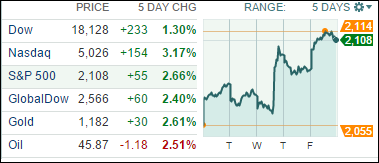
STOCKS CLOSE VOLATILE WEEK ON POSITIVE NOTE
[Chart courtesy of MarketWatch.com]
1. Moving the Markets
It was a volatile week of trading, but U.S. stocks capped off Friday in positive territory lifted by a positive slew of corporate news.
Nike (NKE) announced earnings results that topped analyst forecasts due to increased demand in both North America and China. The stock now sits at a price of $101.98 and is up about 6.06% YTD.
There was big news in the world of pharmaceuticals today. A number of analysts raised their price target on Biogen Idec Inc. (BIIB) after the company’s phase 1 study results for Alzheimer’s treatment were released. According to a number of news reports, the results of the Phase 1 study were better than expected. Shares gained about 7% to close at a price of $463.22.
On the week, stocks moved higher overall. Much of the upside was sparked by Wednesday’s comments from the Fed that an interest rate hike in April remains unlikely. The word “patient” was no longer the buzz word in their statements, however. In the broader U.S. economy, trends allegedly continue to support expectations for more economic growth despite continuously disappointing macro data.
All of our 10 ETFs in the Spotlight marched higher today with the Global S&P 500 (IOO) leading at +1.46% while Healthcare (XLV) lagged with +0.73% but managed to make a new yearly high.
All ETFs are now positive for the year as the table in section 2 below shows.
2. ETFs in the Spotlight
In case you missed the announcement and description of this section, you can read it here again.
It features 10 broadly diversified ETFs from my HighVolume list as posted every Monday. Furthermore, they are screened for the lowest MaxDD% number meaning they have been showing better resistance to temporary sell offs than all others over the past year.
Here are the 10 candidates:
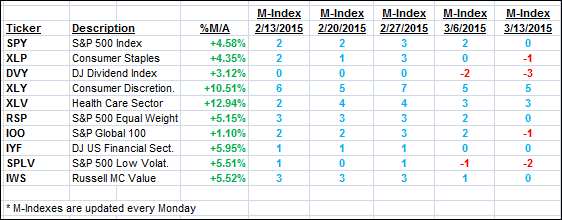
The above table simply demonstrates the magnitude with which some of the ETFs are fluctuating in regards to their positions above or below their respective individual trend lines (%M/A). A break below, represented by a negative number, shows weakness, while a break above, represented by a positive percentage, shows strength.
For hundreds of ETF/Mutual fund choices, be sure to reference Thursday’s StatSheet.
Year to date, here’s how the above candidates have fared so far:
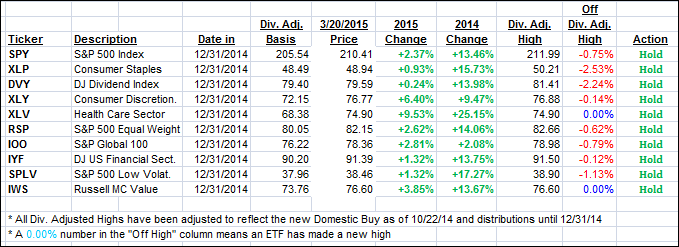
Again, the first table above shows the position of the various ETFs in relation to their respective long term trend lines (%M/A), while the second one tracks their trailing sell stops in the “Off High” column. The “Action” column will signal a “Sell” once the -7.5% point has been taken out in the “Off High” column.
3. Trend Tracking Indexes (TTIs)
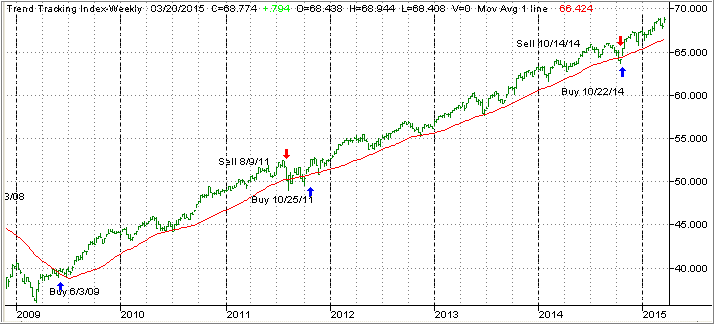
Our Trend Tracking Indexes (TTIs) rallied sharply during this extremely volatile week and moved deeper into bullish territory.
Here’s how we closed:
Domestic TTI: +4.07% (last Friday +2.47%)—Buy signal effective 10/22/2014
International TTI: +4.98% (last Friday +1.98%)—Buy signal effective 2/13/2015
Have a nice weekend.
Ulli…
Disclosure: I am obliged to inform you that I, as well as advisory clients of mine, own some of these listed ETFs. Furthermore, they do not represent a specific investment recommendation for you, they merely show which ETFs from the universe I track are falling within the guidelines specified.
————————————————————-
READER Q & A FOR THE WEEK
All Reader Q & A’s are listed at our web site!
Check it out at:
http://www.successful-investment.com/q&a.php
Reader Bob:
Q: Ulli: I want to thank you for giving us your postings freely. I have been a follower since 2009 when you had the model portfolios.
We got yanked around when it was a traders market and you gave that up and went to posting the ETF listings. I use your momentum index for buy and sell and the TTI for IN and Out criteria. Do you have any desire of starting fund portfolios up again? Thanks again!
A: Bob: Thanks for your kind words. No, I have no intention of starting the model portfolios again. The 10 ETFs in the Spotlight offer far better choices and have proved to be superior in terms of performance. I have recently added the M-Index for the latest 5 weeks, so you can quickly identify which of the 10 is demonstrating better or worse momentum.
———————————————————-
WOULD YOU LIKE TO HAVE YOUR INVESTMENTS PROFESSIONALLY MANAGED?
Do you have the time to follow our investment plans yourself? If you are a busy professional who would like to have his portfolio managed using our methodology, please contact me directly or get more details at:
https://theetfbully.com/personal-investment-management/
———————————————————
Back issues of the ETF/No Load Fund Tracker are available on the web at:
https://theetfbully.com/newsletter-archives/

 The US Federal Reserve’s latest policy statement may have omitted the “patient” word, but there seems to be less certainty in the central bank’s overall tone, indicating the Fed wants to be less predictable about a June rate-hike given the multitude of data that is affecting the US economy, said Matthew Beesley, head of global equities at Henderson Global Investors.