ETF Tracker Newsletter For September 29, 2023

Ulli ETF Tracker Contact

ETF Tracker StatSheet          

You can view the latest version here.

NO TREATS FOR THE BULLS: THE MARKETS ENDED SEPTEMBER AND Q3 IN THE RED

[Chart courtesy of MarketWatch.com]

  1. Moving the markets

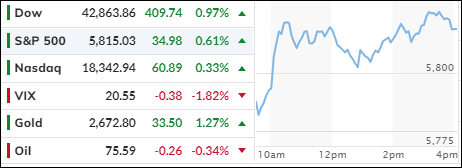
The markets started Friday on a high note, thanks to the latest inflation data that made investors feel optimistic. But the good mood didn’t last long, as the major indexes dumped their gains and ended the month and quarter in the red. Talk about a mood swing!

Friday’s personal consumption expenditures price index reading, which is the Fed’s favorite way to measure inflation, gave the market a boost. The core PCE, which excludes the prices of things that actually matter, like food and energy, rose 0.1% in August and 3.9% year over year. But after three months of deflation, the prices of goods came back with a bang and jumped in August (the highest increase since June 2022). Looks like someone had a growth spurt!

The market suffered big losses for the trading month and quarter, both of which ended today. The S&P 500 finished the month down 5% and the quarter lower by 3.6%. The Nasdaq Composite was off 5% in September, and down 3.3% for the quarter. Both had their worst quarters this year and since Q3 2022. Ouch!

Stocks have fallen too much and too fast during this seasonally volatile time of the year, driven by a long list of worries. The market only a few months ago was worry free, believing that the Fed could land the plane smoothly. But now the market is freaking out, as traders question the economic outlook. And to make things worse, traders also feared a government shutdown this weekend, as House GOP leaders failed to pass a short-term spending bill today. Way to go, guys!

The past three months was the first quarter of tightening financial conditions since 2022, with September being the biggest monthly squeeze in a year. And why is that? It’s simple: the low came right after the “alleged” last Fed hike (July 26). I find that hilarious.

While Q3 was bad, September was even worse, with Energy being the only sector that stayed green. Every other sector got hammered. The bond market was a massacre, not just in the US but globally as well.

ZeroHedge summed it up like this:

  • 5y US yield highest since 2007
  • 10y US yield highest since 2007
  • 30y US yield highest since 2010
  • 10y German yield highest since 2011
  • Japan 10y highest since 2013
  • Japan 20y highest since 2014
  • Japan 30y highest since 2013

The dollar rallied for the second straight month in September to its highest close since Nov 2022. Q3 was the dollar’s first positive quarter since 2022.

Finally, the disconnect between real yields and the S&P 500’s P/E valuation came into the month at a noted extreme. And while the index dropped ~5%, real yields rose too. This chart explains it.

Will the bulls be able to turn things around as we enter red October? Or will they be spooked by more tricks than treats?

Read More

Weekly StatSheet For The ETF Tracker Newsletter – Updated Through 09/28/2023

Ulli ETF StatSheet Contact

ETF Data updated through Thursday, September 28, 2023

How to use this StatSheet:

  1. Out of the 1,800+ ETFs out there, I only pick the ones that trade over $5 million per day (HV ETFs), so you don’t get stuck with a lemon that nobody wants to buy or sell.
  1. Trend Tracking Indexes (TTIs)

These are the main indicators that tell you when to buy or sell Domestic and International ETFs (section 1 and 2). They do that by comparing their position to their long-term M/A (Moving Average). If they cross above, and stay there, it’s a green light to buy. If they fall below, and keep going, it’s a red light to sell. And to make sure you don’t lose your shirt if things go south, I also use a 12% trailing stop loss on all positions in these categories.

  1. All other investment areas don’t have a TTI and should be traded based on the position of each ETF relative to its own trend line (%M/A). That’s why I call them “Selective Buy.” In other words, if an ETF goes above its own trend line, you can buy it. But don’t forget to use a trailing sell stop of 12%, or less if you’re feeling nervous.

If some of these words sound like Greek to you, please check out the Glossary of Terms and new subscriber information in section 9.

  1. DOMESTIC EQUITY ETFs: SELLsince 09/22/2023

Click on chart to enlarge

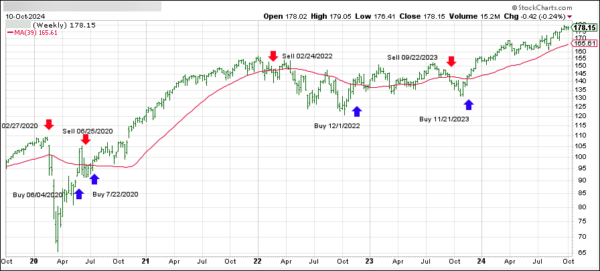
This is our main compass, the Domestic Trend Tracking Index (TTI-green line in the above chart). It has now broken below its long-term trend line (red) by -2.30% and has moved into “Sell” mode effectively 9/22/2023.

Read More

Stocks Rebound On Short Squeeze, But Will It Last?

Ulli Market Commentary Contact

[Chart courtesy of MarketWatch.com]

  1. Moving the markets

Stocks finally got off the floor on Thursday and clung to their gains until the end, as investors watched the wild swings in the bond market with bated breath.

After weeks of getting hammered, the market needed a bounce. A massive short squeeze helped the bulls but don’t get too excited. This rally might fizzle out by next week.

The 10-year Treasury yield soared to a new 15-year high in the morning, as the latest data showed fewer people filing for unemployment benefits than expected. The stock market has been following the bond market like a lost puppy lately.

Any spike in rates makes investors nervous about a recession and sends stocks tumbling. The S&P 500 hit its lowest level since June this week as the 10-year yield reached its highest since 2007.

Friday is the last day of a rough month and quarter for the market. The S&P 500 is set to end the month down 5% and the quarter down 4%. The Nasdaq is doing even worse, losing more than 6% this month and more than 5% this quarter.

Traders will be looking at the latest inflation report on Friday. The PCE index is the Fed’s favorite measure of inflation and, thanks to rising oil prices, it might back up their stance of keeping rates high for longer.

On the economic front, we saw that pending home sales dropped more than expected in August (-7.1% vs. -1%), showing how hard it is for buyers to afford a home with higher interest rates. Jobless claims fell to their lowest level in a year.

Bond yields spiked in the morning but calmed down in the afternoon, giving the rally some breathing room. As yields fell, the dollar lost its mojo and pulled back from its highs. Gold, which usually likes a weaker dollar, dropped, and gave up its $1,900 mark. Oil prices hit $95 overnight, but then lost steam and fell below $92.

Will tomorrow’s inflation report spoil the party?

Stay tuned.

Read More

Inflation Concerns And Tightening Financial Conditions Drive Stock Market Turbulence

Ulli Market Commentary Contact

[Chart courtesy of MarketWatch.com]

  1. Moving the markets

The stock market experienced a wild ride on Wednesday as Wall Street attempted to recover from steep losses seen in the previous session. This rollercoaster was fueled by a dip and then a rip in Treasury yields and the release of positive economic data.

The benchmark 10-year Treasury yield rallied above the 4.6% mark. Similarly, the 2-year Treasury yield soared as well but retreated into the close.

In other news, the Commerce Department reported that orders for durable goods rose 0.2% in August, surpassing Dow Jones’ estimate of a 0.5% decline.

Rising rates have recently exerted pressure on stocks due to concerns that the Federal Reserve might maintain tighter monetary policy for a longer duration than anticipated. On Tuesday, the S&P 500 fell below the key 4,300 level for the first time since June, following disappointing new home sales and consumer confidence data.

The market is currently living up to its seasonally weak September, and its volatility is expected to extend into October. The future direction will depend on earnings season around midmonth, which will reveal whether current market conditions will improve or if we will witness a “red October” outcome.

Inflation remains a significant concern, as investors are anxious about not only the elevated rate but also how it impacts companies with higher borrowing costs. Currently, equities are trading as though hope and confidence are dwindling out of the system, with even a much-hoped-for short squeeze providing little assistance.

Financial conditions are tightening significantly, reaching their tightest levels since November 2022. Meanwhile, real rates are increasing, and the S&P 500 is beginning to retreat, resembling the alligator jaw closing.

The question remains: will this process accelerate?

Read More

S&P 500 Plunges As Home Sales Crash And Consumer Confidence Falls

Ulli Market Commentary Contact

[Chart courtesy of MarketWatch.com]

  1. Moving the markets

The market had a terrible day today, as dismal reports on home sales and consumer confidence sent the S&P 500 to its lowest level in months. The index plunged 1.47%, breaking below 4,300 for the first time since June 9.

The housing market showed signs of cooling down, as new home sales in August crashed and burned. Only 675,000 homes were sold, far below the expected 695,000. That’s a 2.7% drop from July, which was already revised lower.

Consumers were not feeling too confident either, as the Conference Board’s index fell to 103 in September, down from 108.7 in August. Economists were hoping for 105.5, but they were disappointed again. The index hit 73.7, a level that usually means trouble for the economy. Ouch indeed!

JPMorgan Chase CEO Jamie Dimon added salt to the wound, warning that interest rates may need to rise further to fight inflation. He said that going from 5% to 7% would be more painful than going from 3% to 5%. He asked businesspeople if they were prepared for something like 7%, or even worse, stagflation.

He urged his clients to be prepared for stress in the system. That dose of realism did not help the market’s mood for the month. The Nasdaq Composite is down more than 6% in September, while the S&P 500 and Dow lost more than 5% and 3%, respectively.

One of the reasons for the sell-off is the Federal Reserve signaling fewer rate cuts next year. That pushed the benchmark 10-year Treasury yield to levels not seen since 2007.

Traders are on edge, nervous, and uncertain about what the rise in bond yields means for the economy, the stock market, the Fed, and the dollar. With clarity lacking, the best strategy is to simply lighten up on positions.

And if the above is not enough, we have a potential government shutdown looming, and we are heading into the “jinx month” of October, notorious for the 1929 and 1987 crashes.

Amazon got hammered today due to the FTC suing them, hitting 3-month lows, but the whole market looked ugly. Value and Growth stocks both got hit hard, with Growth barely staying positive for the year, while Value is now down 3%.

Bond yields were mixed, the dollar rallied for the fifth day in a row, which took the shine off gold, while crude oil bounced back above $90.

Finally, the Magnificent 7 stocks have lost over $1 trillion in market cap from their July highs, falling back to near 4-month lows.

Looking at the big picture, it’s clear that we are moving from greed to fear in a hurry. That will accelerate even more once the S&P 500 drops below its 4,200 level.

Then, look out below.

Read More

Bond Yields Surge, AI Stocks Rally, And Market Goes Nowhere Fast

Ulli Market Commentary Contact

[Chart courtesy of MarketWatch.com]

  1. Moving the markets

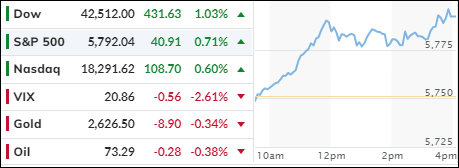
The S&P 500 barely budged Monday as the 10-year Treasury yield soared, and the market started the last week of September with a whimper. But hey, at least the index closed in the green.

The 10-year Treasury yield reached 4.5%, hitting levels not seen since 2007 when it peaked at 4.57%. Remember 2007? Good times.

Meanwhile, Amazon shares climbed more than 1% after the online retail giant said Monday it will invest up to $4 billion in artificial intelligence firm Anthropic. Shares of Nvidia rose 1.5%. AI is hot, hot, hot, despite high interest rates. Go figure…

We are wrapping up a notoriously weak month for markets, as the Federal Reserve signaled higher interest rates for longer, sending bond yields higher. The benchmark 10-year Treasury yield has jumped more than 30 basis points this month to over 4.51%.

The market also dealt with a rally in crude oil and a winning streak in the dollar during the seasonally weak trading month. The S&P 500 has dropped more than 4% in September, on track for its second straight losing month and its worst month since December. The tech-heavy Nasdaq Composite is down 6% in September, as growth stocks took the brunt of the sell-off, also headed for its biggest monthly loss since December.

Traders are also closely watching progress on a budget resolution in Washington. Lawmakers over the weekend showed little signs of movement on a deal that would keep the U.S. government funded for the rest of the fiscal year.

The other risk that can affect the economy is the student loan-payment resumption, which in combination with the government shutdown, could trigger notable declines in GDP.

And, to add insult to injury, inflation threats are re-asserting themselves (via commodities) and hurting sentiment via soaring gasoline prices.

The US Dollar broke out of its trading range to its highest point since December 2022. That move was helped by surging bond yields, with the 10-year exploding higher and reaching October 2007 levels.

Of course, the dollar’s gains were gold’s losses, as the precious metal tumbled to last week’s lows. Oil prices lagged and ended the day unchanged.

With real rates reaching new cycle highs, valuations on stocks are starting to close the alligator jaw, as this chart shows.

Will it snap shut all the way? Or will it just give us a friendly nibble?

Read More