ETF/No Load Fund Tracker Newsletter For April 3, 2015

Ulli ETF Tracker Contact

ETF/No Load Fund Tracker StatSheet

————————————————————-

THE LINK TO OUR CURRENT ETF/MUTUAL FUND STATSHEET IS:

https://theetfbully.com/2015/04/weekly-statsheet-for-the-etfno-load-fund-tracker-newsletter-updated-through-04022015/

————————————————————

Market Commentary

Friday, April 3, 2015

MARKETS BACK ON TOP TO CLOSE OUT THE WEEK

Thur pic

[Chart courtesy of MarketWatch.com]

1. Moving the Markets

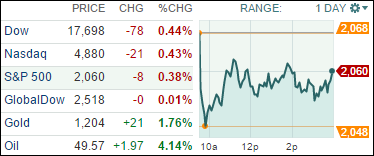
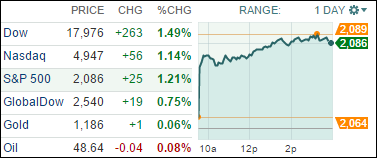
U.S. indexes closed higher after a reading on the labor market came in better than expected. That report raised hopes that Friday’s payroll numbers may also show similar strength for the month of March.

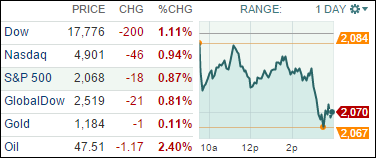
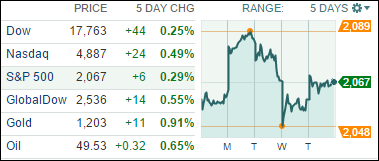
For the week, stocks finished the holiday-shortened week flat. Economic numbers were generally weaker than expected and daily market fluctuations were relatively small overall, with the S&P 500 finishing up 0.5% on the week. Stocks have remained in a relatively narrow range in recent weeks, but normal market volatility could certainly return as we enter Q1 earnings season.

For you oil lovers, we heard today that economic sanctions are limiting oil-rich Iran from exporting crude. News that the U.S. is pushing harder on Iran to limit its nuclear program didn’t bode well for oil investors it seems. Benchmark West Texas Intermediate crude fell 1.2% to $49.47 a barrel, while Brent crude tumbled 3.4% to $55.18.

In the week ahead, the ISM Non-manufacturing Index will be released on Monday, the meeting minutes from the Federal Reserve’s March meeting will be released on Wednesday, and weekly jobless claims will be reported on Thursday.

All of our 10 ETFs in the Spotlight moved higher led by Consumer Discretionaries (XLY) with +0.89%, while Select Dividends (DVY) lagged with a gain of +0.19%.

Read More

Weekly StatSheet For The ETF/No Load Fund Tracker Newsletter – Updated Through 04/02/2015

Ulli ETF StatSheet Contact

ETF/Mutual Fund Data updated through Thursday, April 2, 2015

TOC021915

If you are not familiar with some of the terminology used, please see the Glossary of Terms.


1. DOMESTIC EQUITY MUTUAL FUNDS/ETFs: BUY — since 10/22/2014

TTI

Our main directional indicator, the Domestic Trend Tracking Index (TTI), broke through its long-term trend line generating a “Sell” for this arena effective 10/14/2014, which was followed by a violent break back above the line on 10/22/14 generating a new “Buy.” It was a classic whipsaw signal, and you can read more on my blog as to the events as they were unfolding.

As of today, our TTI (green line in above chart) is positioned above its long term trend line (red) by +2.85% keeping us in the market with our established positions.

Read More

The Equity Slide Continues

Ulli Market Commentary Contact

Wed pic

[Chart courtesy of MarketWatch.com]

1. Moving the Markets

The markets still could not find much footing and continued to slip for the second day, although it could have been a lot worse. In the humor department (it’s April Fool’s day after all), the sucker of the day award has to go to the High Frequency Trading algos, who swallowed the Tesla announcement of a new W-Model, hook, line and sinker. Pretty funny, if it was not so sad, as this story elaborates.

Not helping matters were disappointing employment and manufacturing numbers suggesting the economy is weakening rather than growing. Even though we started this month on a sour note, April is historically a good month for the major indexes as I posted a few days ago. Will have to wait and see if the odds will continue to be on the investor’s side.

9 of our 10 ETFs in the Spotlight closed in the red with only consumer staples (XLP) bucking the trend with a +0.12% gain. Despite today’s sell-off, 8 ETFs remain on the plus side YTD as section 2 below shows.

Read More

A Rough Landing To End Q1, But A New Month Is Coming

Ulli Market Commentary Contact

Tue pic

[Chart courtesy of MarketWatch.com]

1. Moving the Markets

As I mentioned two days ago, March has never been a predictable month historically. Volatility remained in full force again today as stocks tumbled amidst a major sell-off that saw the Dow drop 200 points. The good news is, that the S&P 500 and Nasdaq were able to manage their negative hits today to come out on top over all for the month. What may bring some sunshine to the table though is that this is the Nasdaq’s 9th straight quarterly gain and its longest quarterly winning streak in history, which has many investors remaining bullish on the tech index.

The price of the USD has continued to weigh on investors’ minds as the currency has officially gained 9% for the year and is expected to continue rising in the near future. Speculation as to the tentative (never predictable) hike in interest rates has also been contributing to volatility of late. It shall be interesting to see what the month of April will entail from the Fed.

Shall optimistic bulls charge forward in April? Well, the first trading day of the second quarter (April 1) is just around the corner and has shown strong performance over the past 20 years. Historically, the S&P 500 has advanced 16 times with an average gain of 0.56 percent (according to the Stock Trader’s Almanac).

Let’s see if 2015 brings a historical repeat.

In an abrupt reversal from yesterday, our 10 ETFs in the Spotlight slipped and closed lower. Leading the downside was our YTD winner healthcare (XLV) with -1.73%, while Consumer Discretionaries (XLY) held up best with a loss of only -0.44%.

Read More

Stocks In Rally Mode

Ulli Market Commentary Contact

Mon pic

[Chart courtesy of MarketWatch.com]

1. Moving the Markets

For the second day in a row, the major indexes closed higher, but today the gains were solid as, after a strong opening, stocks never looked back and managed to add to their early gains.

Helping matters were reports from China over the weekend that the PBOC saw “more room” for accommodating monetary policy should the economy stay soft and inflation remain weak. Considering that slowing growth in China had been a major concern that was quite some encouragement and equities took the hint and ran with it.

There was continued softness in consumer spending confirming a slowing economy but pending home sales reached their highest level since the middle of 2013. In the end, good and bad equaled a nice rally.

With today’s sharp move higher, it comes as now surprise that all of our 10 ETFs in the Spotlight closed up led by the Mid-Caps (IWS) with +1.33%; that was closely followed by the low volatility S&P (SPLV), which gained +1.30%.

Read More

ETFs/Mutual Funds On The Cutline – Updated Through 03/27/2015

Ulli ETFs on the Cutline Contact

Below are the latest ETF Cutline reports, which show how far above or below their respective long-term trend lines (39 week SMA) my currently tracked ETFs/MFs are positioned.

The first report covers the ETF Master List from Thursday’s StatSheet and includes 410 ETFs, of which currently 266 (last week 292) are hovering in bullish territory.

The second report includes only High Volume ETFs. To clarify, High Volume (HV) ETFs are defined as those with an average daily volume of $10 million or higher.

These ETFs are generated from my selected list of some 97 that I use in my advisor practice. It cuts out the “noise,” which simply means it eliminates those ETFs that I would never buy because of their volume limitations. 42 ETFs (last week 48) have managed to remain in bullish territory after the recent market volatility.

The third report covers Mutual Funds on the Cutline. There are currently 405 (last week 520) above the line and 415 below it out of the 820 that I follow.

Take a look:

1. ETF Master Cutline Report

2. ETF High Volume Cutline Report

3. MF Cutline Report

In case you are not familiar with some of the terminology used in the reports, please read the Glossary of Terms.

If you missed the original post about the Cutline approach, you can read it here.