
1. Moving the Markets
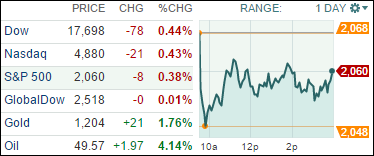
The markets still could not find much footing and continued to slip for the second day, although it could have been a lot worse. In the humor department (it’s April Fool’s day after all), the sucker of the day award has to go to the High Frequency Trading algos, who swallowed the Tesla announcement of a new W-Model, hook, line and sinker. Pretty funny, if it was not so sad, as this story elaborates.
Not helping matters were disappointing employment and manufacturing numbers suggesting the economy is weakening rather than growing. Even though we started this month on a sour note, April is historically a good month for the major indexes as I posted a few days ago. Will have to wait and see if the odds will continue to be on the investor’s side.
9 of our 10 ETFs in the Spotlight closed in the red with only consumer staples (XLP) bucking the trend with a +0.12% gain. Despite today’s sell-off, 8 ETFs remain on the plus side YTD as section 2 below shows.
2. ETFs in the Spotlight
In case you missed the announcement and description of this section, you can read it here again.
It features 10 broadly diversified ETFs from my HighVolume list as posted every Monday. Furthermore, they are screened for the lowest MaxDD% number meaning they have been showing better resistance to temporary sell offs than all others over the past year.
Here are the 10 candidates:
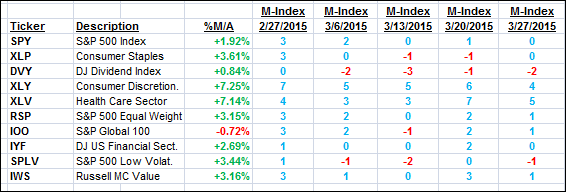
The above table simply demonstrates the magnitude with which some of the ETFs are fluctuating in regards to their positions above or below their respective individual trend lines (%M/A). A break below, represented by a negative number, shows weakness, while a break above, represented by a positive percentage, shows strength.
For hundreds of ETF/Mutual fund choices, be sure to reference Thursday’s StatSheet.
Year to date, here’s how the above candidates have fared so far:
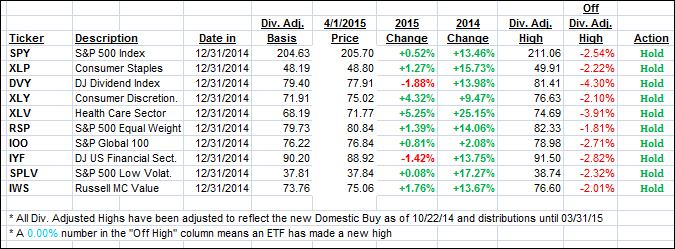
Again, the first table above shows the position of the various ETFs in relation to their respective long term trend lines (%M/A), while the second one tracks their trailing sell stops in the “Off High” column. The “Action” column will signal a “Sell” once the -7.5% point has been taken out in the “Off High” column.
3. Trend Tracking Indexes (TTIs)
Our Trend Tracking Indexes (TTIs) were mixed today with the domestic one sliding slightly while the International one showed a small gain.
Here’s how we closed:
Domestic TTI: +2.68% (last close +2.75%)—Buy signal effective 10/22/2014
International TTI: +3.33% (last close +3.29%)—Buy signal effective 2/13/2015
Disclosure: I am obliged to inform you that I, as well as advisory clients of mine, own some of these listed ETFs. Furthermore, they do not represent a specific investment recommendation for you, they merely show which ETFs from the universe I track are falling within the guidelines specified.
Contact Ulli