World Equities Get Crushed By The Great Fall Of China

Ulli Market Commentary Contact

Mon pic

[Chart courtesy of MarketWatch.com]

1. Moving the Markets

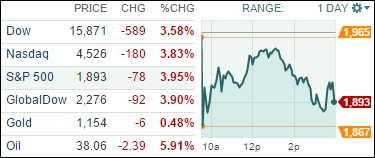
It all started with China’s Shanghai index dropping some 8.5% and the European markets following closely by losing some 5%. U.S. equities took a huge tumble at the opening, rallied back to almost even before succumbing to last hour selling.

China has been a story in itself with their index having gained this year at one point about 60%; it’s now in negative territory, which makes it another nail in the coffin of the buy-and-hold crowd.

The Dow was down a jaw dropping 1,000 points early on before recovering to a loss of “only” 589 points. Commodity prices continued their slide down the black diamond slope. Pricing was so out of whack this morning that the VIX did not have any quotes for some 30 minutes as it shot above the 50 level for the first time since 2009. Volatility was incredibly high as short option premiums soared and long ones got crushed.

As trend trackers it’s clear that the bear market has arrived, as I mentioned last Friday. What is not known is the magnitude of this event. For sure, there will be the usual menu of jawboning by the Fed as to the assistance they will give via a new QE program or the dismissal of the anticipated interest rate hike, or some other brilliant kick the can down the road plan. Just wait and listen for it…

The question in my mind is this: will any Fed action/promises have a long lasting effect on propping up the equity markets? The Chinese just tried it over the past few weeks and it failed miserably.

My point is that this event could be short lived or turn into a bear market disaster similar to 2008 or worse. Nobody knows. The smart thing right now is to be on the sidelines and let others take the hit. There will be a time when it safer to re-enter than right now. Remember the old saying that “I’d rather be out of the market wishing I was in, than in the market wishing I was out.”

All of our 10 ETFs in the Spotlight got hammered today as all markets did their best swan dive imitation. Good thing we had only one sector ETF left, which I sold during the morning rebound. At the close, the downside leader was surprisingly the Low Volatility ETF (SPLV), which gave back -5.28%. Getting spanked the least was the Select Dividend ETF (DVY) with -3.48%.

We are now clearly in bear market territory, as the TTIs in section 3 below show:

Read More

ETFs/Mutual Funds On The Cutline – Updated Through 08/21/2015

Ulli ETFs on the Cutline Contact

Below are the latest ETF Cutline reports, which show how far above or below their respective long-term trend lines (39 week SMA) my currently tracked ETFs/MFs are positioned.

The first report covers the ETF Master List from Thursday’s StatSheet and includes 410 ETFs, of which currently 36 (last week 152) are hovering in bullish territory.

The second report includes only High Volume ETFs. To clarify, High Volume (HV) ETFs are defined as those with an average daily volume of $10 million or higher.

These ETFs are generated from my selected list of some 97 that I use in my advisor practice. It cuts out the “noise,” which simply means it eliminates those ETFs that I would never buy because of their volume limitations. 7 ETFs (last week 24) have managed to remain in bullish territory after the recent market volatility.

The third report covers Mutual Funds on the Cutline. There are currently 48 (last week 367) above the line and 772 below it out of the 820 that I follow.

Take a look:

  1. ETF Master Cutline Report
  2. ETF High Volume Cutline Report
  3. MF Cutline Report

In case you are not familiar with some of the terminology used in the reports, please read the Glossary of Terms.

If you missed the original post about the Cutline approach, you can read it here.

One Man’s Opinion: Will Global Turmoil Materially Impact US Growth?

Ulli Market Review Contact

ManInvestors would be making a mistake if they map the ongoing commodity weakness into a general global slowdown which would impact the US as well, said Scott Mather, CIO at PIMCO.

Investors should not forget the reduction in commodity prices is a good thing for US growth and most developed world consumer of commodities. So if anything, it’s a boost in growth. The drop in interest rates partially offsets some of the strengthening in the dollar.

So, people shouldn’t become too gloomy about global growth at this point as much of the downturn is a thing of the past, and it won’t be a surprise to see the impact six months hence as easy monetary policy is really beginning to lift growth globally. Investors should be careful in misinterpreting the drop in commodity prices as it has a lot to do with a supply glut rather than a fall-off in demand, he noted.

Read More

New ETFs On The Block: Principal EDGE Active Income ETF (YLD)

Ulli Income ETFs Contact

91551519Principal Financial Group, the financial behemoth with $500 billion in assets under management and better known for its range of 401(k) retirement plans, insurance products and mutual funds, recently forayed into the exchange traded funds segment.

The newly launched Principal EDGE Active Income ETF (YLD) is sub-advised by Principal’s EDGE Asset Management unit and seeks to provide current income by investing in six income producing asset classes. Generally speaking, multi-asset ETFs provide exposure to a wide range of asset classes and provide much needed diversification to income investment products.

While YLD is an actively managed fund, it seeks to beat the performance of the Barclays US Corporate High Yield 2% Issuer Capped Bond Index by using tactical asset allocation methods. In a sense, the fund is a pretty much “go-anywhere” product as the portfolio manager can invest across asset classes and geographic boundaries in search of income.

Read More

ETF/No Load Fund Tracker Newsletter For August 21, 2015

Ulli ETF Tracker Contact

ETF/No Load Fund Tracker StatSheet

————————————————————-

THE LINK TO OUR CURRENT ETF/MUTUAL FUND STATSHEET IS:

https://theetfbully.com/2015/08/weekly-statsheet-for-the-etfno-load-fund-tracker-newsletter-updated-through-08202015/

————————————————————

Market Commentary

THE BEAR MARKET HAS ARRIVED: DOMESTIC AND INTERNATIONAL TTIs IN “SELL” MODE

Fri pic

[Chart courtesy of MarketWatch.com]

1. Moving the Markets

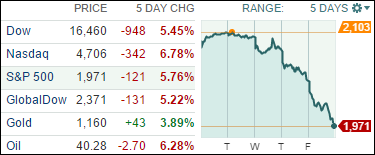
Stocks have been in a world of pain this week as selloffs continued. The Dow lost 531 points today, dropping to 16,459 and the “C” word (correction) started being floated around Wall Street. As far as my indicators are concerned, we have entered bear market territory, and to me the question is how far down will we go?

Concerns about global economic growth, especially in the world’s second largest economy (China), have been an increasing weight on the stock market. China’s cooling economy has caused the Shanghai index to tumble drastically this week despite a massive government intervention. Throw in uncertainty about when the Federal Reserve is going to raise interest rates for the first time in more than a decade, and investors are losing their confidence in holding onto stocks.

Oil remained under pressure Friday as U.S. crude fell as low as $39.86 a barrel—a level last seen in February 2009 in the depths of the financial crisis. Brent crude, the international benchmark, tumbled 60 cents to $46.02 in London after losing 54 cents the previous day to close at $46.62.

Here in the U.S., economic data released this week was neutral as we saw a mix of surprises to the upside and downside. Housing starts were better than expected, which supports many analysts’ views that the housing market will continue to improve. The Consumer Price Index, which measures inflation, failed to move significantly higher. This lack of price movement could cause more market participants to think that the Fed may wait even longer to raise interest rates.

It will be interesting to see how markets may or may not rebound come Monday.

All of our 10 ETFs in the Spotlight headed south with the indexes with Consumer Discretionaries (XLY) faring the worst by losing -3.13%. Holding up best was the Dividend ETF (DVY), which surrendered “only” -2.07%.

For the effect on our Trend Tracking Indexes (TTIs), please read section 3 below:

Read More

Weekly StatSheet For The ETF/No Load Fund Tracker Newsletter – Updated Through 08/20/2015

Ulli ETF StatSheet, Uncategorized Contact

ETF/Mutual Fund Data updated through Thursday, August 20, 2015

TOC 082115

If you are not familiar with some of the terminology used, please see the Glossary of Terms.


1. DOMESTIC EQUITY MUTUAL FUNDS/ETFs: BUY — since 10/22/2014

TTI

Our main directional indicator, the Domestic Trend Tracking Index (TTI), broke through its long-term trend line generating a “Sell” for this arena effective 10/14/2014, which was followed by a violent break back above the line on 10/22/14 generating a new “Buy.” It was a classic whipsaw signal, and you can read more on my blog as to the events as they were unfolding.

As of today, our TTI (green line in above chart) just has just broken below its long term trend line (red) by -0.67%. As I posted, I want to see a clear piercing below the trend line before issuing a “Sell” signal.

Read More