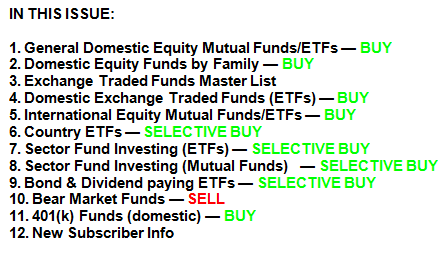
ETF/No Load Fund Tracker Newsletter For June 12, 2015
ETF/No Load Fund Tracker StatSheet
————————————————————-
THE LINK TO OUR CURRENT ETF/MUTUAL FUND STATSHEET IS:
https://theetfbully.com/2015/06/weekly-statsheet-for-the-etfno-load-fund-tracker-newsletter-updated-through-06112015/
————————————————————
Market Commentary
POOR FINISH TO A MEDIOCRE WEEK
[Chart courtesy of MarketWatch.com]
1. Moving the Markets
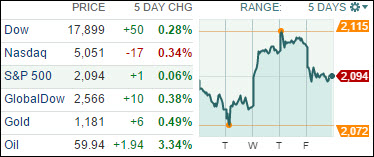
Stocks ended lower Friday as investors digested a double dose of bad European news—the U.K. getting slapped with a “negative” outlook and Greece’s stalled bailout talks. Greece’s ASE index tanked 5.9% on news that the IMF had left talks in Brussels because a lack of progress. That came just a day after the ASE got an 8% rocket boost in the other direction—when good feelings predominated over debt discussions. The country faces a June 30 deadline for a major debt payment.
Major indexes were mixed on the week, with energy leading decliners and financials leading advancing sectors. The Dow Jones Industrial Average rose 50 points to end the week at 17,899, up 0.3%.
It was a great day for Wingstop (WING) today during their first day of trading. Shares gained nearly 60% to close at $30.42 a share, up from $11.42. The company’s IPO consisted of 5.8 million shares.
Looking to next week, Wednesday brings what likely will be the most watched event of the week, when the Federal Open Market Committee announces its interest rate decision from its June meeting. Other events of note include industrial production on Monday, housing starts on Tuesday, and both CPI and leading economic indicators indexes on Thursday.
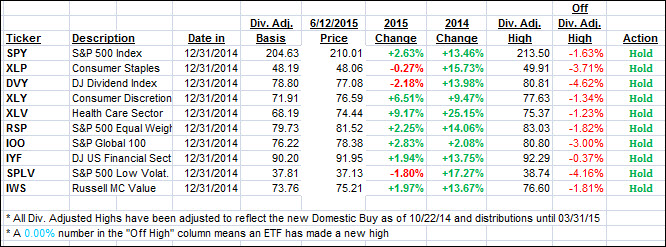
All of our 10 ETFs in the Spotlight slipped as the bears got the upper hand for the day. Healthcare (XLV) gave back 1.23%, while the Financials (IYF) resisted the sell off better by surrendering only 0.37%.
2. ETFs in the Spotlight
In case you missed the announcement and description of this section, you can read it here again.
It features 10 broadly diversified ETFs from my HighVolume list as posted every Monday. Furthermore, they are screened for the lowest MaxDD% number meaning they have been showing better resistance to temporary sell offs than all others over the past year.
Here are the 10 candidates:
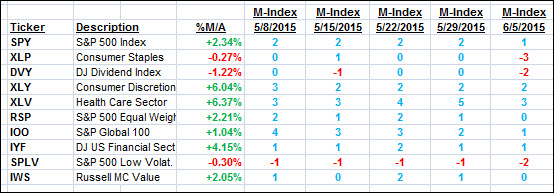
The above table simply demonstrates the magnitude with which some of the ETFs are fluctuating in regards to their positions above or below their respective individual trend lines (%M/A). A break below, represented by a negative number, shows weakness, while a break above, represented by a positive percentage, shows strength.
For hundreds of ETF/Mutual fund choices, be sure to reference Thursday’s StatSheet.
Year to date, here’s how the above candidates have fared so far:
Again, the first table above shows the position of the various ETFs in relation to their respective long term trend lines (%M/A), while the second one tracks their trailing sell stops in the “Off High” column. The “Action” column will signal a “Sell” once the -7.5% point has been taken out in the “Off High” column.
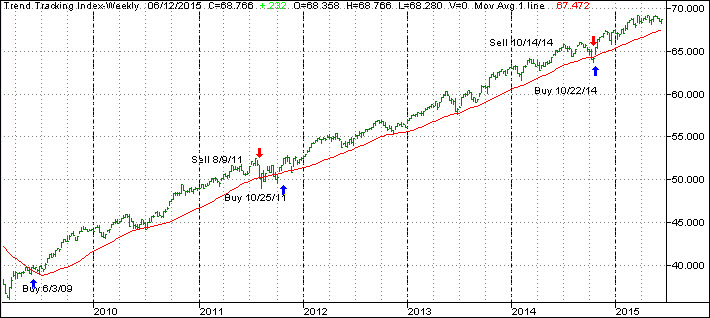
3. Trend Tracking Indexes (TTIs)
Our Trend Tracking Indexes (TTIs) retreated with the major indexes but remain bullish. Here’s how we ended this week:
Domestic TTI: +1.59% (last Friday +1.70%)—Buy signal effective 10/22/2014
International TTI: +3.33% (last Friday +3.21%)—Buy signal effective 2/13/2015
Have a nice weekend.
Ulli…
Disclosure: I am obliged to inform you that I, as well as advisory clients of mine, own some of these listed ETFs. Furthermore, they do not represent a specific investment recommendation for you, they merely show which ETFs from the universe I track are falling within the guidelines specified.
————————————————————-
READER Q & A FOR THE WEEK
Reader Bob:
Q: Ulli: I am in the process of rebalancing/creating a portfolio & I am hesitant to allocate 40% or so (I am 64) to bond funds with the likelihood of an interest rate increase coming possibly sometime in 2015. I am thinking it may be prudent to put that 40% (or so) I would allocate to bonds in cash & wait & see what happens in the coming months.
My questions are (1) would you recommend buying a general bond fund (BND) now, or, if not, (2) would you recommend a bond fund focusing on high-yield corporate bonds (VWEHX or ETF equivalent) or intermediate bonds (VFICX or ETF equivalent), or keep the money in cash?
Alternatively, I have also been thinking about simply adopting the Vanguard 4-core portfolio (w/VTI [39%]; VXUS [24%]; BND [27%]; and BNDX [10%], but hesitate to do so because of the bond funds.
Guess I am confused regarding why not sit and wait in cash until the dust settles, while knowing trying to time the market is oftentimes a fool’s game.
I always greatly appreciate your thoughts and wisdom surrounding these complex issues. Hope to hear from you.
Best always to you & yours.
A: Bob: At this time, I personally would not touch any bonds at all. If you look around the world and see the erratic behavior of yields, crushing bond prices in the process, it’s best to stand aside from that asset class for the time being. Cash would be the better option, at least to me, rather than some of the funds you mentioned.
I would stick with whatever portion you have invested in equities subject to my recommended sell stop discipline. Let others take chances with the bond market. There will be a time again where they make more sense than right now. Again, my advice is always the same: If you are hesitant at all, don’t do it, just because some joker thinks the 60/40 allocation scheme is suitable for anyone at anytime.
All Reader Q & A’s are listed at our web site!
Check it out at:
http://www.successful-investment.com/q&a.php
———————————————————-
WOULD YOU LIKE TO HAVE YOUR INVESTMENTS PROFESSIONALLY MANAGED?
Do you have the time to follow our investment plans yourself? If you are a busy professional who would like to have his portfolio managed using our methodology, please contact me directly or get more details at:
https://theetfbully.com/personal-investment-management/
———————————————————
Back issues of the ETF/No Load Fund Tracker are available on the web at:
https://theetfbully.com/newsletter-archives/