Hope Of A Solution In Greece Fuels Rebound

Ulli Market Commentary Contact

Tue pic

[Chart courtesy of MarketWatch.com]

1. Moving the Markets

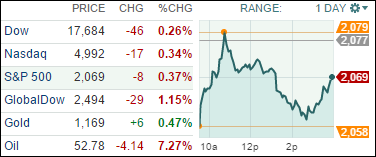
Things looked very dicey for the S&P 500, and the markets in general, as the indexes dropped sharply after the opening. The S&P touched the 2,044 level, which was a break below its widely followed 200-day moving average.

A close around the lows of the day may have generated a “Sell” signal for domestic equity funds/ETFs, but the Greek PM came to the rescue by proposing some interim financing until the end of July.

That was all it took, and the hope rally, which at this point looks like a giant dead cat bounce, shifted into high gear with the indexes staging an amazing turnaround as the S&P sported an intra-day range of 37 points. As I mentioned before, volatility is here to stay a while longer until the mess in Greece gets sorted out—one way or another.

All of our 10 ETFs in the Spotlight participated and closed up with Consumer Staples (XLP) leading the charge at +2.06%, while the Financials (IYF) lagged with a more modest gain of 0.18%.

Read More

Equities Pull Back As Outlook For Greece Remains Uncertain

Ulli Market Commentary Contact

Mon pic

[Chart courtesy of MarketWatch.com]

1. Moving the Markets

It was a roller coaster ride as the major indexes dropped at the open, then managed to climb above the unchanged line before slipping again but rallying into the close.

So far, the fallout has been worse in Europe but uncertainty and subsequent volatility may stay with us for a while. Via Sunday’s referendum, Greece essentially divorced itself from the current bailout terms, but we are in uncharted territory here, so there is no precedent as to the next steps involved.

The whipping boy of the day was oil, which got spanked and lost over 7% as the chart above shows. It is certain that the Greece story will remain in the headlines and will further affect world markets. The degree of any potential fallout is unknown, but to us, following the major trends in the markets, the only thing that matters is whether this current uptrend is sustained or not. Be sure to tune in regularly to watch the Trend Tracking Indexes (TTI) in section 3 below to see if any Sell signals are being generated.

All of our 10 ETFs in the Spotlight retreated moderately with the Global 100 (IOO) taking the lead to the downside with -1.15%, while Consumer Staples (XLP) held up best by giving back only -0.08%.

Read More

ETFs/Mutual Funds On The Cutline – Updated Through 07/02/2015

Ulli ETFs on the Cutline Contact

Below are the latest ETF Cutline reports, which show how far above or below their respective long-term trend lines (39 week SMA) my currently tracked ETFs/MFs are positioned.

The first report covers the ETF Master List from Thursday’s StatSheet and includes 410 ETFs, of which currently 195 (last week 240) are hovering in bullish territory.

The second report includes only High Volume ETFs. To clarify, High Volume (HV) ETFs are defined as those with an average daily volume of $10 million or higher.

These ETFs are generated from my selected list of some 97 that I use in my advisor practice. It cuts out the “noise,” which simply means it eliminates those ETFs that I would never buy because of their volume limitations. 31 ETFs (last week 35) have managed to remain in bullish territory after the recent market volatility.

The third report covers Mutual Funds on the Cutline. There are currently 418 (last week 539) above the line and 402 below it out of the 820 that I follow.

Take a look:

1. ETF Master Cutline Report

2. ETF High Volume Cutline Report

3. MF Cutline Report

In case you are not familiar with some of the terminology used in the reports, please read the Glossary of Terms.

If you missed the original post about the Cutline approach, you can read it here.

One Man’s Opinion: Does The June Jobs Report Show That A Rate Hike Is Unlikely This Year?

Ulli Market Review Contact

ManThe latest non-farm payroll report showed the US economy added 223,000 jobs in June, well below expectations for a 245,000 increase, and when the net 60,000 downward revision for the previous two months are factored in, the moot question that needs to be asked is whether the markets were actually overzealous about labor market conditions, said Lindsey Piegza, chief economist at Stifel Financial.

Furthermore, the drop in the unemployment rate, which could partially be attributed to a record low labor force participation rate that was last seen in the seventies, fully reflects the fact that nearly half-a-million Americans dropped out of the labor force.

Also, the average hourly earnings show a non-existent wage pressure. So, frankly speaking, no component of the employment report suggests growing confidence in the labor market strength, something the Fed has been clear they want to see in order to justify a near-term rate increase, she observed.

Read More

New ETFs On The Block: Elkhorn S&P 500 Capital Expenditures Portfolio (CAPX)

Ulli Equity ETFs Contact

Bull-BearWhen it comes to innovation, there’s hardly any segment in the financial sector that can beat the exchange-traded funds industry. With more than 1,700 products and about $2.1 trillion in assets under management, it all points to an industry that flourishes on novelty and is more dynamic than every before.

It’s no surprise then that a new product with a brand-new investment strategy hit the blocks recently, for offering another way to dice the S&P 500 index with an aim to give tailor made exposure in large-cap stocks.

The newly launched Elkhorn S&P 500 Capital Expenditures Portfolio (CAPX) is the first ETF from Ben Fulton-founded Elkhorn Investments LLC. Fulton is an industry veteran who headed Invesco Powershares’ Global ETF division and founded Elkhorn in 2013. Fulton, credited with turning Invesco into a leader of alternative indexing, has built a team he worked with for decades in the industry, indicating a deep expertise in the so-called “smart beta” category.

Read More

ETF/No Load Fund Tracker Newsletter For July 3, 2015

Ulli ETF Tracker Contact

ETF/No Load Fund Tracker StatSheet

————————————————————-

THE LINK TO OUR CURRENT ETF/MUTUAL FUND STATSHEET IS:

https://theetfbully.com/2015/07/weekly-statsheet-for-the-etfno-load-fund-tracker-newsletter-updated-through-07022015/

————————————————————

Market Commentary

A SECOND STRAIGHT LOSING WEEK

Fri pic

[Chart courtesy of MarketWatch.com]

1. Moving the Markets

It was a volatile Holiday-shortened week with the major indexes succumbing to the bearish forces again. As I reported the past four days, the culprit was Greece and its unresolved debt problems along with its referendum scheduled for this coming Sunday. Any surprise outcome in regards to its eurozone membership will surely affect the markets, but very likely more so in Europe than here is the U.S.

On the domestic side, we saw today’s mixed jobs report which, along with weekly unemployment claims came in weaker than expected. While the unemployment rate slipped to 5.3% 223,000 new jobs were added but, unfortunately, the estimated numbers for April and May were sharply reduced and more people left the labor force. It was a report that certainly did not give much ammunition to the Fed in terms of justifying an interest rate increase in the near future.

9 of our 10 ETFs in the Spotlight slipped as the bears maintained the upper hand this week. Only the Dividend ETF (DVY) managed to squeeze out a gain of 0.33% during yesterday’s low volume pre-Holiday session.

Read More