ETF/No Load Fund Tracker Newsletter For November 13, 2015

Ulli ETF Tracker Contact

ETF/No Load Fund Tracker StatSheet

————————————————————-

THE LINK TO OUR CURRENT ETF/MUTUAL FUND STATSHEET IS:

https://theetfbully.com/2015/11/weekly-statsheet-for-the-etfno-load-fund-tracker-newsletter-updated-through-11122015-2/

————————————————————

Market Commentary

DIVE ON WALL STREET CONTINUES; DOMESTIC TTI SELL SIGNAL CONFIRMED
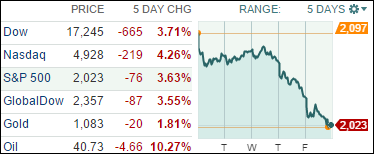
Fri pic

[Chart courtesy of MarketWatch.com]

1. Moving the Markets

Stocks fell sharply again Friday as Wall Street suffered a third straight day of losses and the worst weekly loss in 10 weeks.

It seems investors are finding more reasons to hold off on buying stocks, with worries ranging from overvalued stocks, higher interest rates, weak results from key retailers like Macy’s (M) and ongoing angst over the impact of China’s economic slowdown.

Traders were also digesting October retail sales numbers that disappointed, which added to more recent fears about the strength of the Holiday selling season prompted by weak earnings and guidance from department stores Macy’s and Nordstrom.

Oil prices continued to fall as well today, as the U.S. benchmark crude was on the verge of dropping below $40 a barrel. West Texas Intermediate crude dropped 2% to $40.77 a barrel.

This morning, when checking the markets, I was greeted with a sea of red numbers around the world. So I did what I posted yesterday by not only liquidating some of our sector funds but I opted to go to cash 100%. Good thing as the downside momentum accelerated into the close, which may not bode well for Monday’s opening.

This brings to an end a very short domestic Buy cycle, which lasted barely 10 days. Again, the idea of Trend Tracking is to sidestep portfolio destroying bear markets. To accomplish this goal, we will have to occasionally participate in “whip-saw” signals, which are simply a form of insurance we have to pay in order to avoid a potential disaster. For the exact TTI numbers, please see section 3 below.

As the sell-off gained steam, all of our 10 ETFs in the Spotlight headed south with the worst performer of the day being Consumer Discretionaries (XLY) by surrendering -2.63%. Holding up well was Healthcare (XLV), which posted a modest -0.24% loss.
Read More

Weekly StatSheet For The ETF/No Load Fund Tracker Newsletter – Updated Through 11/12/2015

Ulli ETF StatSheet Contact

ETF/Mutual Fund Data updated through Thursday, November 12, 2015

TOC110515

If you are not familiar with some of the terminology used, please see the Glossary of Terms.


1. DOMESTIC EQUITY MUTUAL FUNDS/ETFs: BUY — since 11/04/2015

TTI

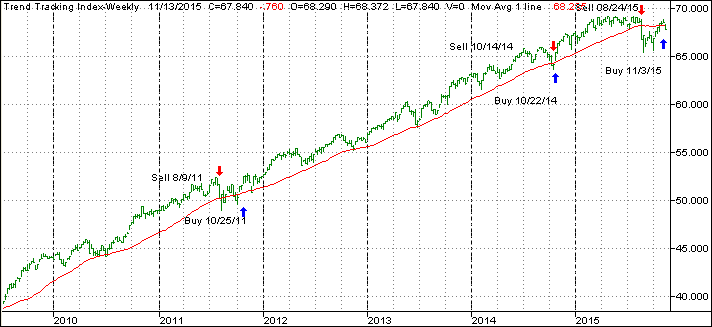
Our main directional indicator, the Domestic Trend Tracking Index (TTI-green line in above chart) has recently crawled above its long term trend line (red) and finally generated a new “Buy” signal effective 11/3/15. However, this week’s market action has pulled this index -0.67% below its long term trend line putting us on the cusp of a “Sell” signal. Please see today’s blog post for important details.

Read More

Swimsuits Necessary As Markets Go Underwater; Domestic TTI In Bearish Territory Again

Ulli Market Commentary Contact

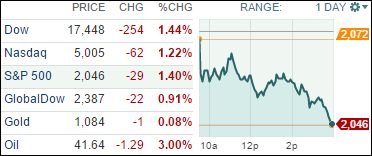
Thur pic

[Chart courtesy of MarketWatch.com]

1. Moving the Markets

Stocks tumbled during an ugly session as the Dow dropped and the S&P 500 slid back into the red for the year.

A sharp drop in oil prices were the partial culprit for today’s decline. Energy shares led the decliners for a second straight day as oil prices tumbled again after a government report showed crude stockpiles grew by 4.2 million more barrels than expected last week. U.S. benchmark crude fell 2.7% to $41.77 a barrel and has dropped five of the last six days.

Also giving investors pause today were renewed fears about valuations, which have climbed back into overvalued territory following the big post-August rally and ongoing concerns about the economic impact of a slowdown in China.

There were several attempts throughout the day by a top line up of Fed officials to try to talk the markets back higher. ZH posted the following chart on this topic:

Read More

A Quiet And Mixed Tuesday

Ulli Market Commentary Contact

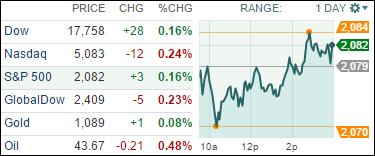
Tue pic

[Chart courtesy of MarketWatch.com]

1. Moving the Markets

Today was a relatively lackluster scene on Wall Street, wherein the Nasdaq finished a bit lower and the S&P 500 and Dow a bit higher.

Apple (AAPL) moved markets a bit early on in the day, shortly after a report was released from Credit Suisse which hinted that the company has decreased its number of orders for the iPhone by about 10%.

Economic data was a bit limited today and focused primarily on the import and export prices, and Crude oil. Crude oil rallied to $44.70 a barrel about halfway through the day, after a report by the IEA that projected prices of the black gold moving back up to around $80 a barrel by 2020. The increase in consumption, of course, is due to rising demand from China and India.

There was an interesting bit of news on the telecommunications front today from T-Mobile (TMUS). The company announced a new program that will allow customers to watch video online without it counting towards data consumption, starting November 15. Investors had mixed reactions to the news it seems, as the stock closed about $1.53 lower.

9 of our 10 ETFs in the Spotlight managed to gain as Consumer Discretionaries (XLY) took the lead with +0.95%. The loser of the day was the Global 100 (IOO) with -0.36%.

Read More

Stocks Slide To Begin The Week; Q3 Earnings Still Not Impressive; Domestic TTI Slips And Touches Its Trend Line

Ulli Market Commentary Contact

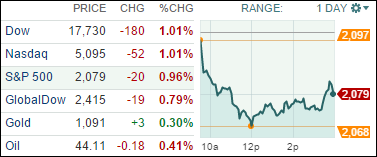
Mon pic

[Chart courtesy of MarketWatch.com]

1. Moving the Markets

Stocks slipped to kick off a new week of trading. It seemed as if investors are adjusting their portfolios for a likely interest rate hike from the Fed in December after an allegedly strong reading on jobs growth in October. All indexes fell about 1% on the day.

With third quarter earnings season wrapping up, investors are now looking to see how the end of the year will unfold in regards to corporate profits. The general consensus amongst analysts at present is that the fourth quarter won’t be any more impressive than the third. Companies in the S&P 500 are expected to post 3.7% lower adjusted profit in the final quarter of 2015.

If these predictions are correct, it would mark the second quarter in a row for declines. All but 50 of the companies in the S&P 500 have reported third-quarter results and profits are down about 1.6%, according to Cap IQ.

We heard an interesting bit of info from United Arab Emirates’ energy minister today. In a statement to the press, he said he believes oil prices will have a correction next year, partly due to the fact that he anticipates the UAE will increase daily production to 3.5 million barrels. The Emirates currently produces about 2.9 million barrels of oil a day and was the sixth-largest oil producer in 2014. If that comes true, the US fracking industry will be in for a world of hurt.

None of our 10 ETFs in the Spotlight was able to buck the trend and close above the unchanged line. The bears were clearly in charge today pushing all indexes lower with Consumer Discretionaries (XLY) giving back -1.38%, while the Dividend ETFs (DVY) held up the best by surrendering only -0.48%.

The Domestic TTI headed south and broke its trend line by a tiny -0.01%. Please see section 3 for important details.

Read More

ETFs/Mutual Funds On The Cutline – Updated Through 11/6/2015

Ulli ETFs on the Cutline Contact

Below are the latest ETF Cutline reports, which show how far above or below their respective long-term trend lines (39 week SMA) my currently tracked ETFs/MFs are positioned.

The first report covers the ETF Master List from Thursday’s StatSheet and includes 381 ETFs, of which currently 97 (last week 91) are hovering in bullish territory.

The second report includes only High Volume ETFs. To clarify, High Volume (HV) ETFs are defined as those with an average daily volume of $10 million or higher. Volume figures can change in a hurry, so be sure to check first before investing.

These ETFs are generated from my selected list of some 97 that I use in my advisor practice. It cuts out the “noise,” which simply means it eliminates those ETFs that I would never buy because of their volume limitations. 17 ETFs (last week 18) have managed to remain in bullish territory after the recent market volatility.

The third report covers Mutual Funds on the Cutline. There are currently 315 (last week 226) above the line and 485 below it out of the 800 that I follow.

Take a look:

  1. ETF Master Cutline Report
  2. ETF High Volume Cutline Report
  3. MF Cutline Report

In case you are not familiar with some of the terminology used in the reports, please read the Glossary of Terms.

If you missed the original post about the Cutline approach, you can read it here.