Weekly StatSheet For The ETF/No Load Fund Tracker Newsletter – Updated Through 08/27/2015

Ulli ETF StatSheet Contact

ETF/Mutual Fund Data updated through Thursday, August 27, 2015

TOC 082715

If you are not familiar with some of the terminology used, please see the Glossary of Terms.


1. DOMESTIC EQUITY MUTUAL FUNDS/ETFs: SELL — since 8/24/2015

TTI

Our main directional indicator, the Domestic Trend Tracking Index (TTI), broke through its long-term trend line generating a “Sell” for this arena effective 10/14/2014, which was followed by a violent break back above the line on 10/22/14 generating a new “Buy.” It was a classic whipsaw signal, and you can read more on my blog as to the events as they were unfolding.

As of today, our TTI (green line in above chart) is positioned below its long term trend line (red) by -1.46% after having generated a “Sell” signal as of 8/24/2015, which applies to all “broadly diversified domestic equity ETFs/Mutual Funds.”

Read More

Indexes Continue Rising Despite China Concerns

Ulli Market Commentary Contact

Thur pic

[Chart courtesy of MarketWatch.com]

1. Moving the Markets

Stocks surged again as Wall Street built on the Dow’s historic rally Wednesday. Order is now allegedly restored in the U.S. stock market following its first dip into correction territory in four years. Investor angst is on the decline and stock prices were again on the rise following the Dow’s nearly 620-point, 4% gain Wednesday, a much-needed and hoped for rebound that restored a sense of stability to a nervous market following a nearly 15% drop for the blue-chip stock gauge from its May 19 high.

Pushing the rally forward were fresh signs that the U.S. economy is still powering on despite slowing growth in China, including a strong revised reading released today on second-quarter GDP, which came in at 3.7%, up from an initial estimate of 2.3%, and comments from a Federal Reserve member Wednesday that pointed out that the reasons for a September interest-rate hike were “less compelling” following the recent market turbulence caused by China’s growth scare. I mentioned earlier in the week that chances were good that a Fed member might jawbone the markets higher similar to October last year; and they did not disappoint.

While this rebound has a a little ways to go before we can declare this bearish period to be in the rear view mirror, odds are high that volatility is still with us and bearish forces could take over again quickly. We’ll have to wait and see how things play out until we have clear evidence that the bull is still alive and kicking before making new commitments to the market.

For the second day in a row, all of our 10 ETFs in the Spotlight participated in the rebound and closed higher. The leader of the day was the Mid-Cap Value ETF (IWS) with +2.95%; lagging the bunch was Consumer Staples (XLP) with a more modest gain of +1.38%.

Despite two days of sharp rallies, our TTIs remain on the bearish side of their trend lines as you can see in section 3 below.

Read More

A Rebound With Legs Or Another Dead Cat Bounce?

Ulli Market Commentary Contact

Wed pic

[Chart courtesy of MarketWatch.com]

1. Moving the Markets

The Dow rebounded big time today, surging nearly 620 points, which is its third-best daily point gain ever and best since 2008. This finally ended a painful six-day losing streak and gave Wall Street the signs of stabilization it has been craving after its worst rout in four years.

Giving the markets a boost early Wednesday was a strong reading on durable goods orders in July, orders for large-ticket items like dishwashers and washing machines. The 2% rise helped boost confidence about the U.S. economy.

While stocks in China ended the volatile trading session lower, the losses were not as dramatic as seen in recent days—only about -1%. Chinese officials took steps to shore up its economy and markets Tuesday by cutting interest rates and taking steps to make it easier for banks to lend money to borrowers.

The big question now remains as to whether this was just another dead cat bounce or a rebound with legs. Of course, nobody has that answer, and it’s way to early to make any assessment of the market, since we just went bearish last Friday. Fast and furious moves are rarely a sign of directional strength; they merely confirm uncertainty and nothing else.

We need to see a slow and steady up-move, maybe some sideways meandering followed by a break of our TTIs to the upside. Then we have something tangible we can work with. Until that break occurs, I consider all moves, up and down, simply part of bear market turmoil.

All of our 10 ETFs in the Spotlight showed some green numbers for a change with all sectors participating in the rebound. The leader was the Low Volatility ETF (SPLV) with +4.87%. Lagging a bit was the Select Dividend ETF (DVY) with +2.17%. See section 3 below for the effect on our Trend Tracking Indexes.

Read More

Bounceback Tuesday Turns into Vicious Sell-off—China Dumps Again

Ulli Market Commentary Contact

Tue pic

[Chart courtesy of MarketWatch.com]

1. Moving the Markets

This morning, China’s Shanghai index took another cliff dive at the tune of some 7.6%, but the European and U.S. markets simply ignored it as they were busy celebrating the Tuesday bounce-back, which took the Dow up by some 440 points.

Unfortunately, the euphoric feeling did not last, and the major indexes participated in a last hour selling frenzy that wiped out all morning gains and pulled stocks deeper into bear market territory making this a classic dead cat bounce. Apparently, China did matter.

Over the past 30 years, I have observed that large point gains in the indexes rarely occur in bull markets but are predominantly a sharp reflex response once our domestic TTI has moved into bear market territory. In fact, six of the largest point gains occurred between September 2008 and March 2009. You can read about it here.

At this time I expect continued volatility with large drops being followed by sharp rebounds with bias being to the downside. I hope you took the opportunity this morning to bail out of any equity holdings you had left. Remember, markets tend to go down a lot faster than they go up.

All of our 10 ETFs in the Spotlight headed south again, as the hope rally ran out of steam. Leading the downside was the Select Dividend ETF (DVY) with a loss of -1.84%. Resisting the sell-off best was the Consumer Discretionaries ETF (XLY), which gave back -0.43%.

Read More

World Equities Get Crushed By The Great Fall Of China

Ulli Market Commentary Contact

Mon pic

[Chart courtesy of MarketWatch.com]

1. Moving the Markets

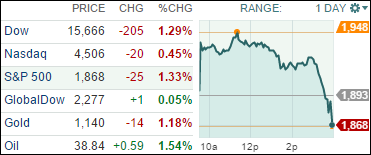
It all started with China’s Shanghai index dropping some 8.5% and the European markets following closely by losing some 5%. U.S. equities took a huge tumble at the opening, rallied back to almost even before succumbing to last hour selling.

China has been a story in itself with their index having gained this year at one point about 60%; it’s now in negative territory, which makes it another nail in the coffin of the buy-and-hold crowd.

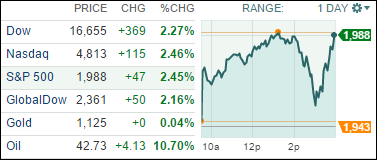
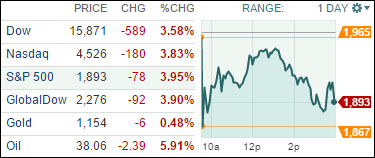
The Dow was down a jaw dropping 1,000 points early on before recovering to a loss of “only” 589 points. Commodity prices continued their slide down the black diamond slope. Pricing was so out of whack this morning that the VIX did not have any quotes for some 30 minutes as it shot above the 50 level for the first time since 2009. Volatility was incredibly high as short option premiums soared and long ones got crushed.

As trend trackers it’s clear that the bear market has arrived, as I mentioned last Friday. What is not known is the magnitude of this event. For sure, there will be the usual menu of jawboning by the Fed as to the assistance they will give via a new QE program or the dismissal of the anticipated interest rate hike, or some other brilliant kick the can down the road plan. Just wait and listen for it…

The question in my mind is this: will any Fed action/promises have a long lasting effect on propping up the equity markets? The Chinese just tried it over the past few weeks and it failed miserably.

My point is that this event could be short lived or turn into a bear market disaster similar to 2008 or worse. Nobody knows. The smart thing right now is to be on the sidelines and let others take the hit. There will be a time when it safer to re-enter than right now. Remember the old saying that “I’d rather be out of the market wishing I was in, than in the market wishing I was out.”

All of our 10 ETFs in the Spotlight got hammered today as all markets did their best swan dive imitation. Good thing we had only one sector ETF left, which I sold during the morning rebound. At the close, the downside leader was surprisingly the Low Volatility ETF (SPLV), which gave back -5.28%. Getting spanked the least was the Select Dividend ETF (DVY) with -3.48%.

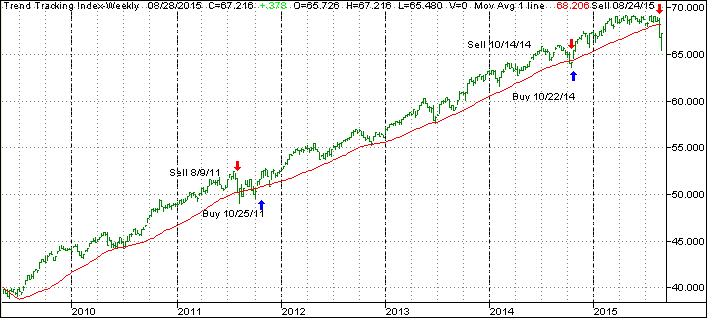
We are now clearly in bear market territory, as the TTIs in section 3 below show:

Read More

ETFs/Mutual Funds On The Cutline – Updated Through 08/21/2015

Ulli ETFs on the Cutline Contact

Below are the latest ETF Cutline reports, which show how far above or below their respective long-term trend lines (39 week SMA) my currently tracked ETFs/MFs are positioned.

The first report covers the ETF Master List from Thursday’s StatSheet and includes 410 ETFs, of which currently 36 (last week 152) are hovering in bullish territory.

The second report includes only High Volume ETFs. To clarify, High Volume (HV) ETFs are defined as those with an average daily volume of $10 million or higher.

These ETFs are generated from my selected list of some 97 that I use in my advisor practice. It cuts out the “noise,” which simply means it eliminates those ETFs that I would never buy because of their volume limitations. 7 ETFs (last week 24) have managed to remain in bullish territory after the recent market volatility.

The third report covers Mutual Funds on the Cutline. There are currently 48 (last week 367) above the line and 772 below it out of the 820 that I follow.

Take a look:

  1. ETF Master Cutline Report
  2. ETF High Volume Cutline Report
  3. MF Cutline Report

In case you are not familiar with some of the terminology used in the reports, please read the Glossary of Terms.

If you missed the original post about the Cutline approach, you can read it here.