Markets Hit Pause As Traders Await Retail Earnings And Fed Signals

Ulli Market Commentary Contact

[Chart courtesy of MarketWatch.com]

  1. Moving the market

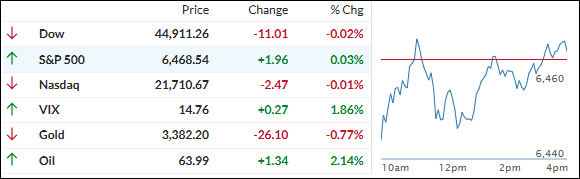
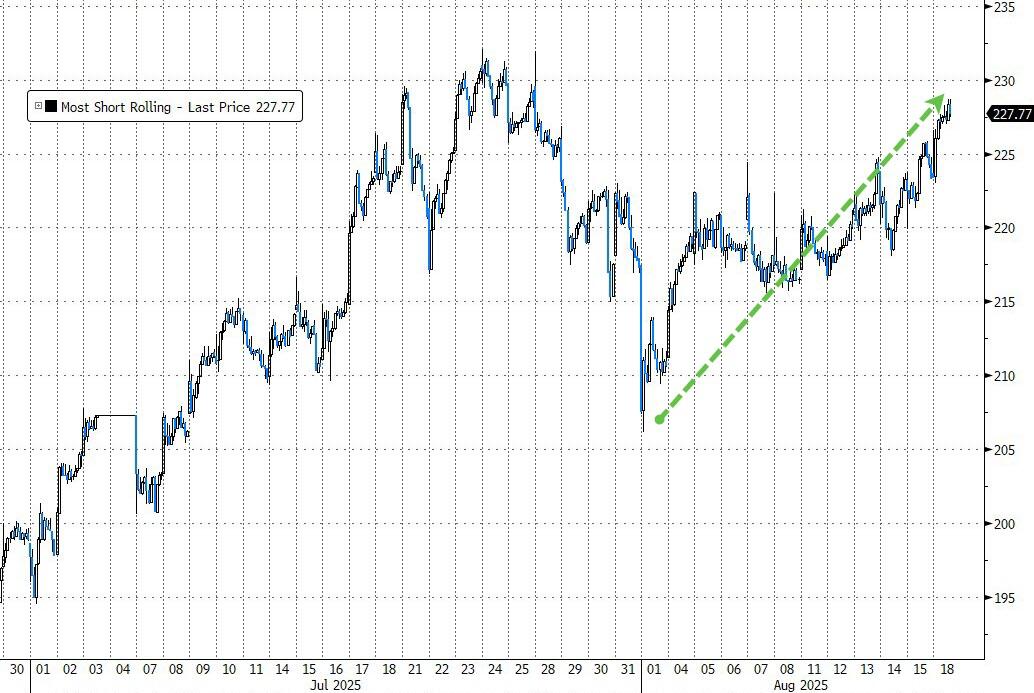
It was a pretty uneventful Monday on Wall Street as the major indexes mostly hovered near the flat line. After a strong run last week, traders seemed content to take a breather while they wait for some big retail earnings, updates on Ukraine, and—most of all—a speech from Fed Chair Powell later this week.

All eyes are on results from retail heavyweights like Home Depot, Lowe’s, Walmart, and Target. These reports are expected to provide fresh insight into the state of the U.S. consumer.

There’s also plenty of Fed-watching going on, as central bankers head to Jackson Hole for their big annual meetup. Traders are looking for any clues about what’s next for interest rates, and the odds of a rate cut at the September meeting are now hovering around 85%.

The indexes are coming off two solid weeks, with the S&P 500 and Nasdaq up in four of the last five weeks. Small caps stole the show last week as traders kept betting on a friendlier Fed.

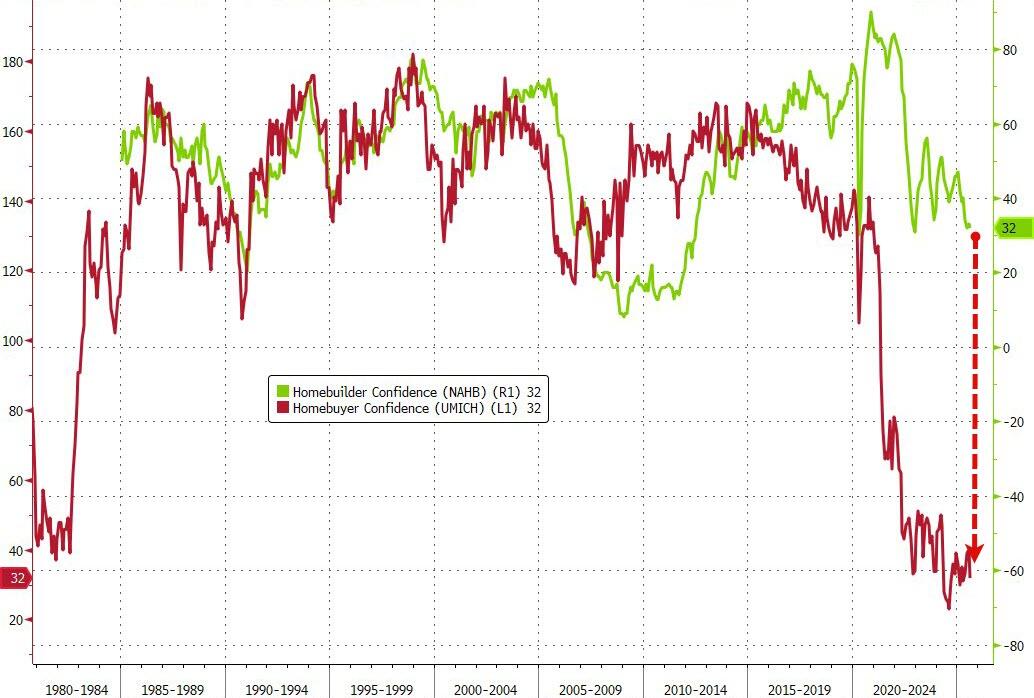
On the housing front, homebuyer confidence remains stuck at rock-bottom, and homebuilder sentiment just dropped to lows not seen since the early days of the pandemic. Despite that, homebuilders still seem to be in a better spot than the buyers themselves, at least for now.

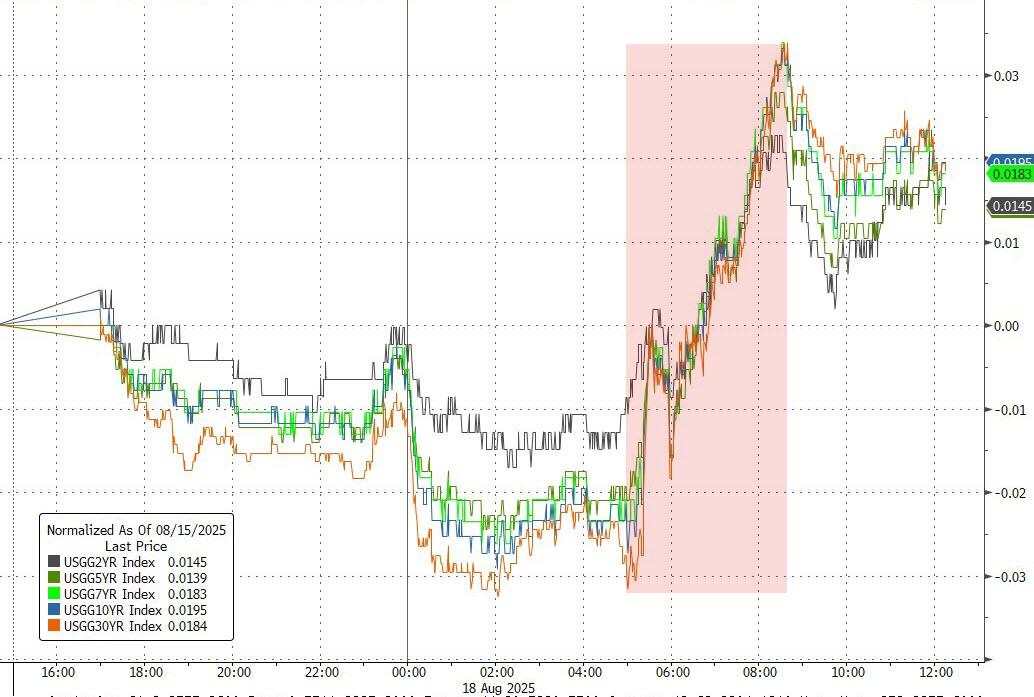
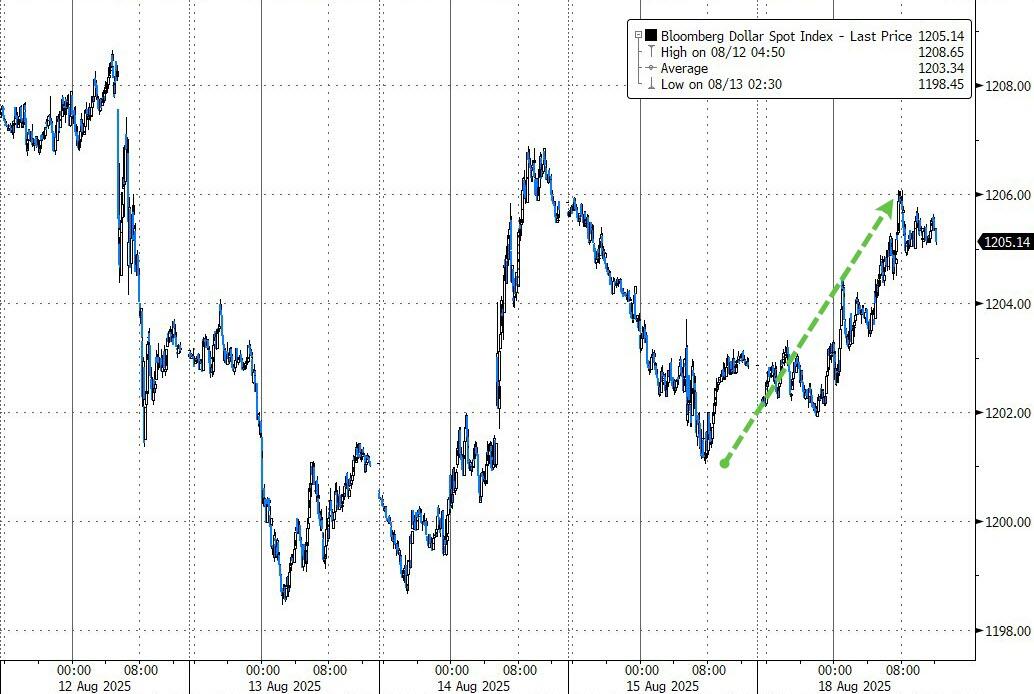
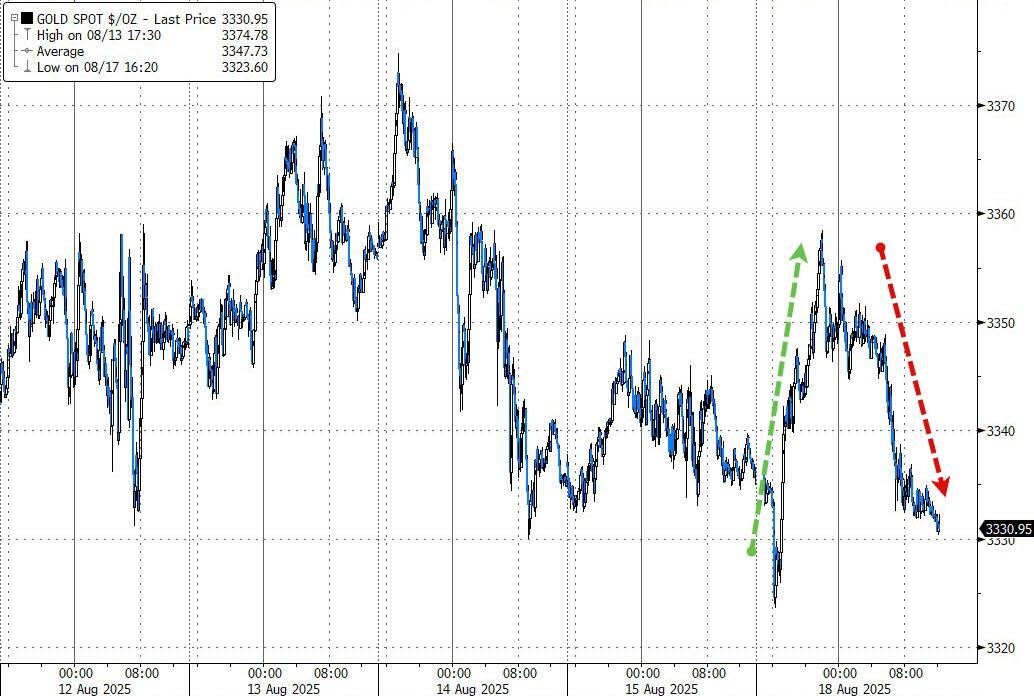
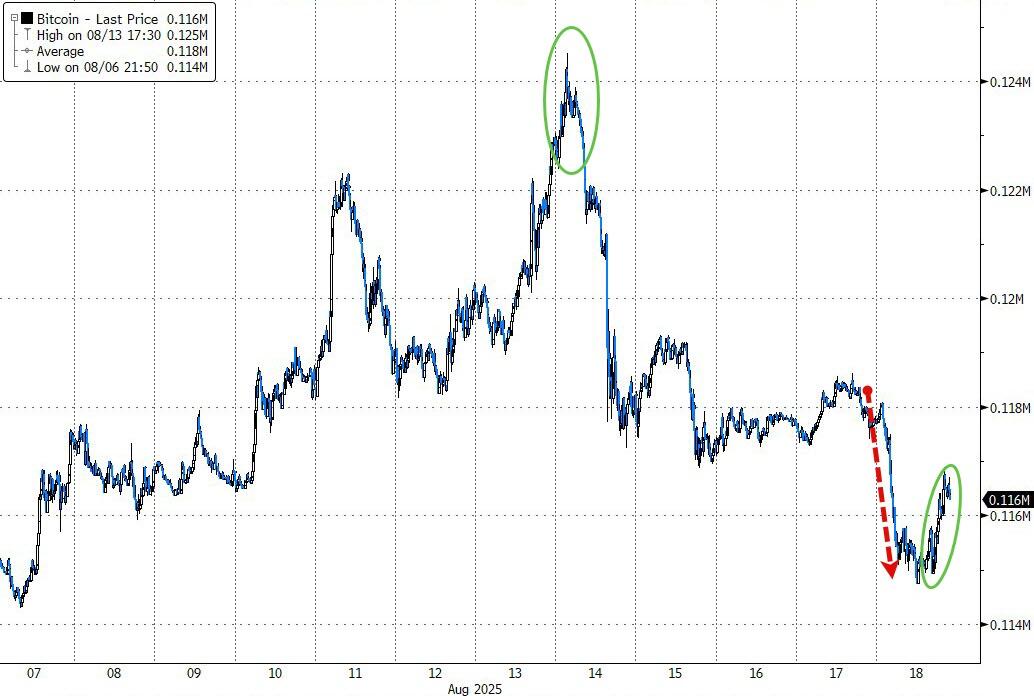
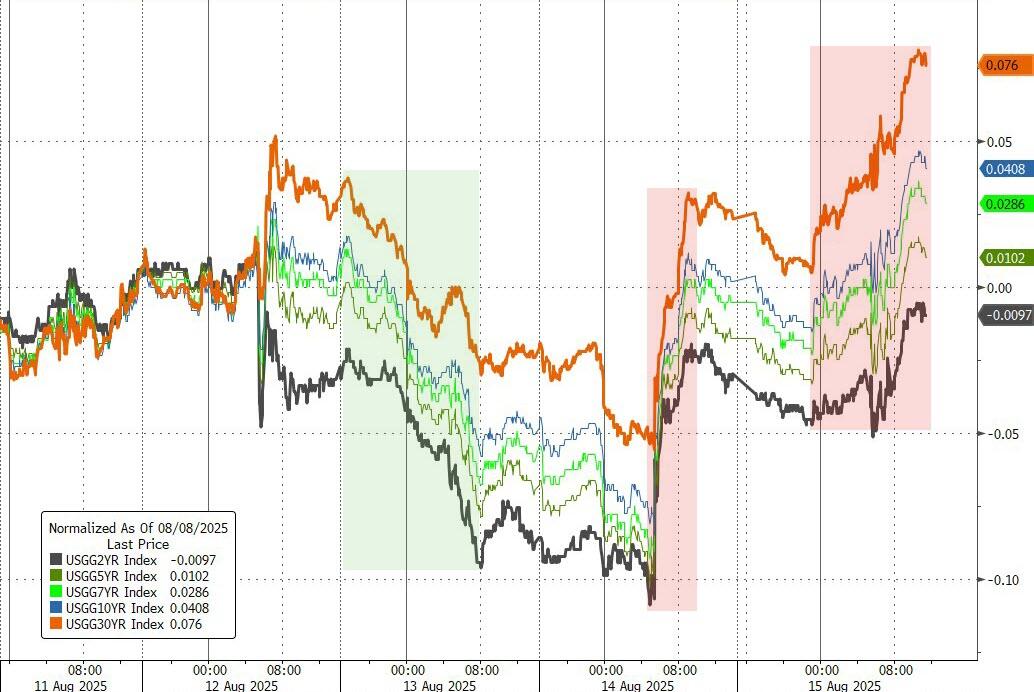
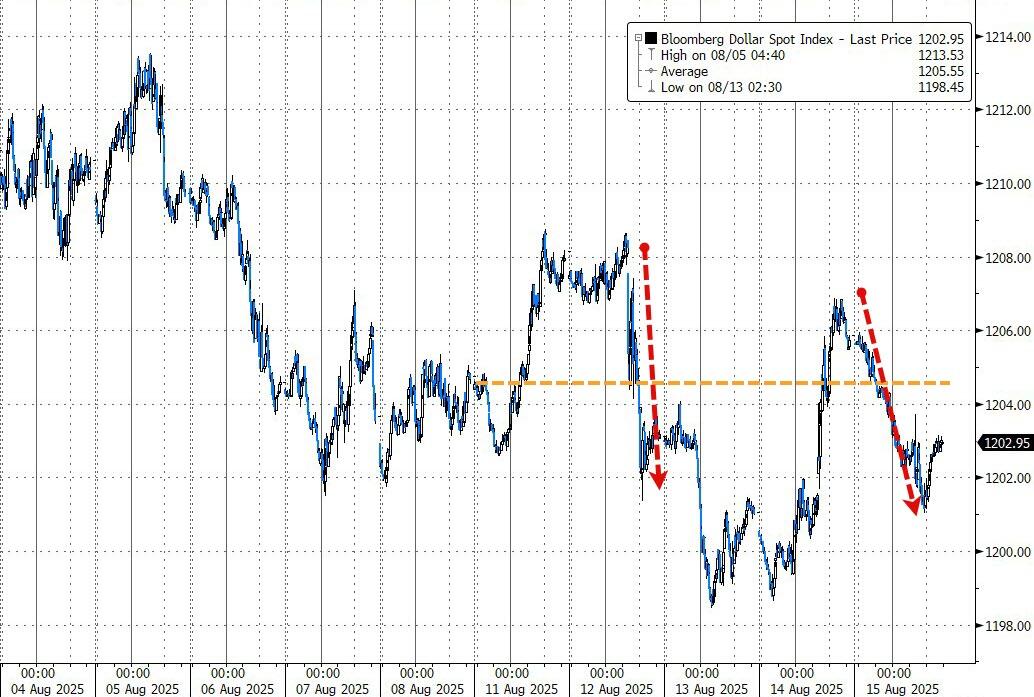
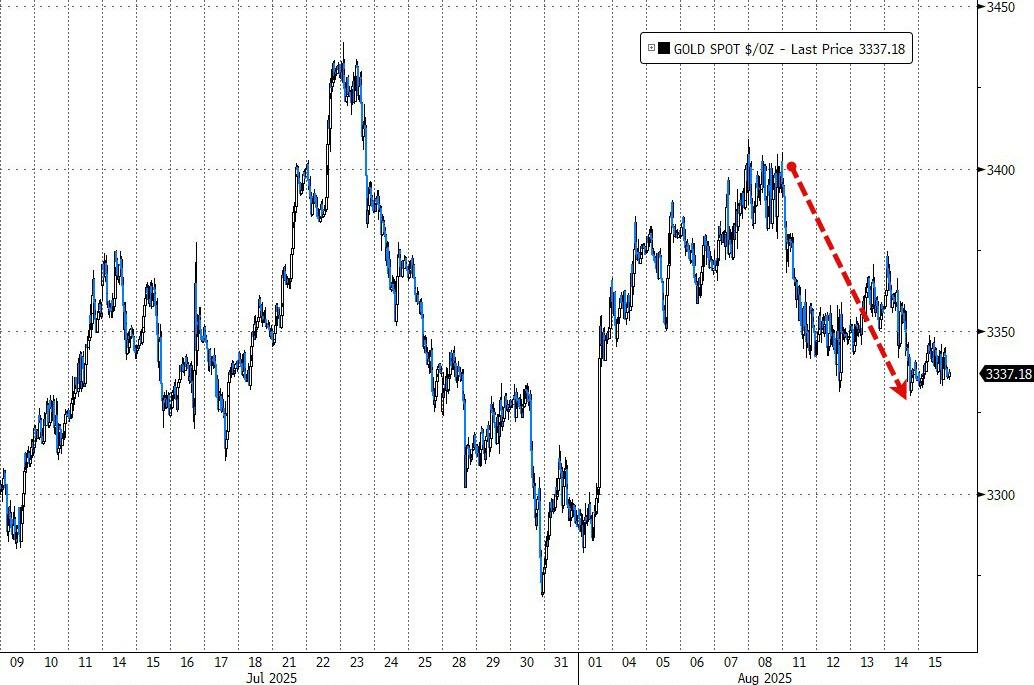
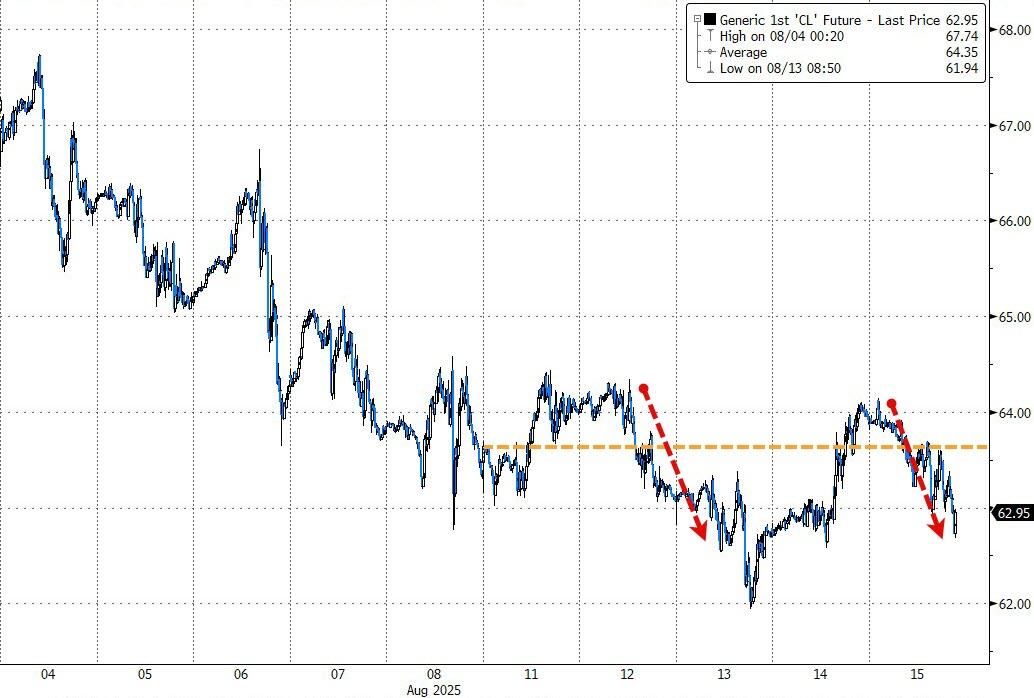
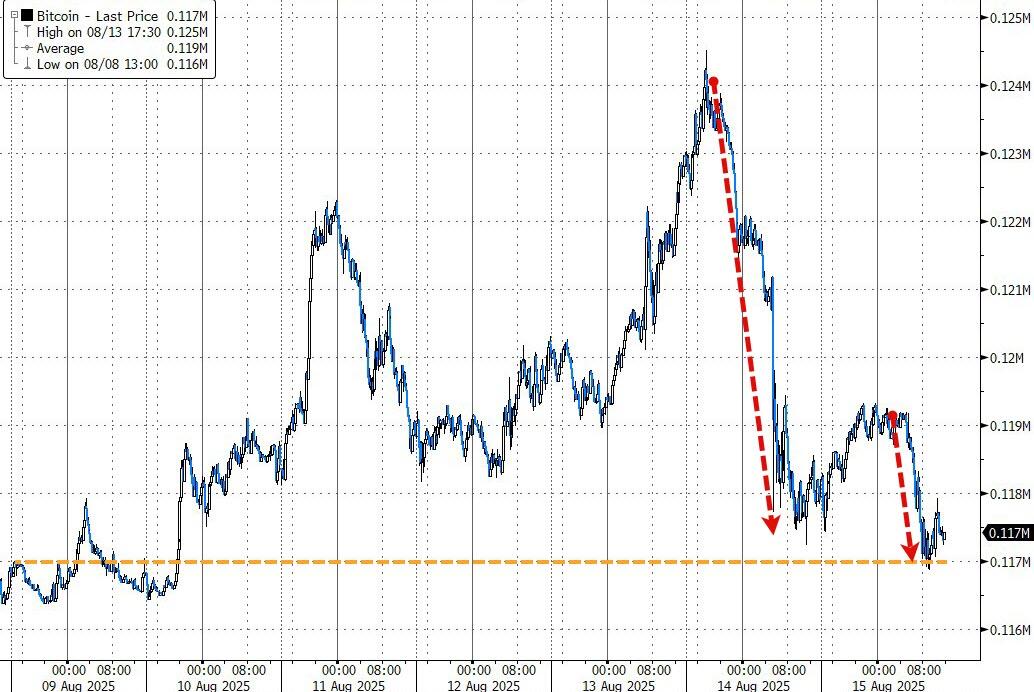
Today’s short squeeze mostly gave a lift to small caps. Bond yields ticked up a bit, the dollar bounced off Friday’s dip, and gold slipped just a hair. Bitcoin, which smashed through $124,000 last week, cooled off but built a solid base around the $116,000 mark.

With the final weeks of summer here and traders glued to Powell’s Jackson Hole speech this Friday, will markets stay in cruise control, or are we in for a surprise as the headlines roll in?

Read More
ETFs On The Cutline – Updated Through 08/15/2025

Ulli ETFs on the Cutline Contact

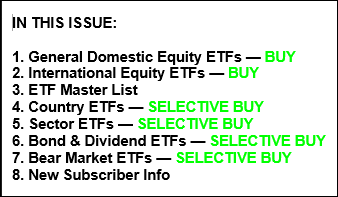
Do you want to know which ETFs are hot and which ones are not? Then you need my High-Volume ETF Cutline report. It tells you how close or far each of the 311 ETFs I follow is from its long-term trend line (39-week SMA). These are the ETFs that trade more than $5 million a day, so they are not some obscure funds that nobody cares about.

The report is split into two parts: The winners that are above their trend line (%M/A), and the losers that are below it. The yellow line is the line of shame that separates them. You can see how many ETFs are in each group and how they have changed since the last report (257 vs. 271 current).

Take a peek:

The HV ETF Master Cutline Report

If you are confused by some of the terms we use, don’t panic. I have a helpful Glossary of Terms for you.

If you want to learn more about the Cutline method and how it can make you rich (or at least less poor), read my original post here.

ETF Tracker Newsletter For August 15, 2025

Ulli ETF Tracker Contact

ETF Tracker StatSheet          

You can view the latest version here.

DOW LEADS WEEKLY GAINS AS TRADERS EYE FED, CHIP STOCKS STUMBLE

[Chart courtesy of MarketWatch.com]

  1. Moving the market

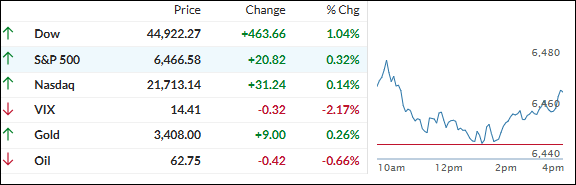
The S&P 500 dipped a bit on Friday after hitting fresh record highs, as traders took the chance to lock in some gains.

Still, it was a solid week across the board—the Dow led the pack, jumping 2%, while the S&P 500 and Nasdaq each notched more than 1% gains. Optimism over possible Fed rate cuts, fueled by tame inflation data, kept the mood upbeat despite some bumps.

Chip stocks and weak consumer sentiment poured a little cold water on the market today. Applied Materials slumped over 11%, dragging the semiconductor sector lower, and Nvidia slipped 1%.

On the economic front, the University of Michigan’s consumer sentiment index fell to 58.6—down from 61.7—as worries about inflation crept back in. Still, retail sales for July rose 0.5%, in line with expectations, showing the U.S. consumer is hanging in there.

Looking ahead, traders are betting the AI boom and hopes for Fed cuts can keep this rally alive, even as we head into the historically choppy waters of late summer. Whether that optimism pays off, especially with Fed Chair Powell’s Jackson Hole speech on deck next week, is anyone’s guess.

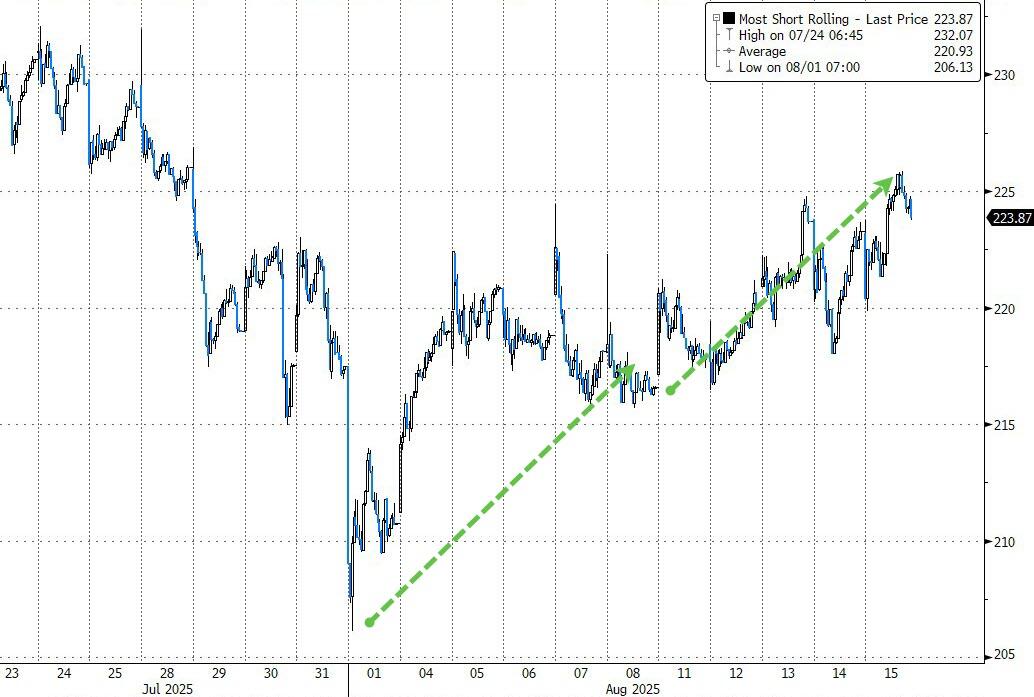
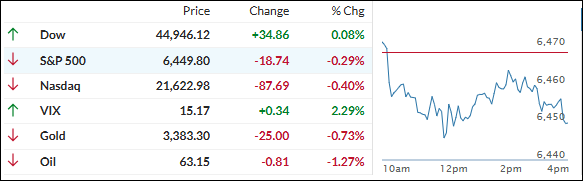
By the closing bell: stocks and bond yields finished higher, the dollar dipped slightly, gold took it on the chin, oil was flat, and bitcoin eased off after hitting new highs. Short sellers keep getting squeezed—11 weeks and counting for the “most shorted” stocks.

With the “dog days” of summer in full swing, will Powell’s speech at Jackson Hole set the next big move—or just add to the summer haze?

Read More

Weekly StatSheet For The ETF Tracker Newsletter – Updated Through 08/14/2025

Ulli ETF StatSheet Contact

ETF Data updated through Thursday, August 14, 2025

How to use this StatSheet:

  1. Out of the 1,800+ ETFs out there, I only pick the ones that trade over $5 million per day (HV ETFs), so you don’t get stuck with a lemon that nobody wants to buy or sell.
  1. Trend Tracking Indexes (TTIs)

These are the main indicators that tell you when to buy or sell Domestic and International ETFs (section 1 and 2). They do that by comparing their position to their long-term M/A (Moving Average). If they cross above, and stay there, it’s a green light to buy. If they fall below, and keep going, it’s a red light to sell. And to make sure you don’t lose your shirt if things go south, I also use a 12% trailing stop loss on all positions in these categories.

  1. All other investment areas don’t have a TTI and should be traded based on the position of each ETF relative to its own trend line (%M/A). That’s why I call them “Selective Buy.” In other words, if an ETF goes above its own trend line, you can buy it. But don’t forget to use a trailing sell stop of 12%, or less if you’re feeling nervous.

If some of these words sound like Greek to you, please check out the Glossary of Terms and new subscriber information in section 9.

  1. DOMESTIC EQUITY ETFs: BUY— effective 5/20/2025

Click on chart to enlarge

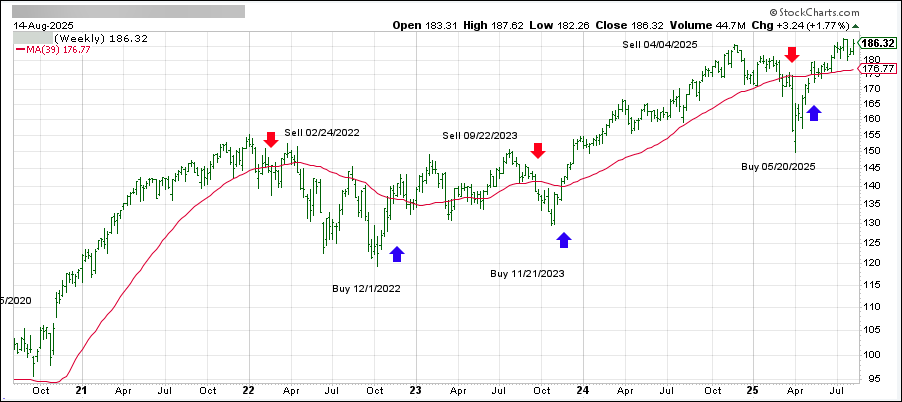
This is our main compass, the Domestic Trend Tracking Index (TTI-green line in the above chart). It has broken above its long-term trend line (red) by +5.52% and remains in “Buy” mode, with our new holdings being subject to our trailing sell stops.

Read More

Hot PPI Report Halts Rally, But Big Tech Powers Market Recovery

Ulli Market Commentary Contact

[Chart courtesy of MarketWatch.com]

  1. Moving the market

Stocks stumbled out of the gate today after a much hotter-than-expected wholesale inflation report rattled traders and threatened the recent rally. The major indexes clawed their way back from early losses but by the closing bell were basically stuck at flat.

The initial slide came right after July’s Producer Price Index (PPI) showed wholesale prices jumping 0.9% for the month—way above the 0.2% economists had forecast, and the biggest monthly jump in three years.

That’s got Wall Street rethinking just how soon—and how much—the Fed might be able to cut rates. Even so, fed funds futures still show nearly 93% odds of a rate cut in September, just a shade lower than before.

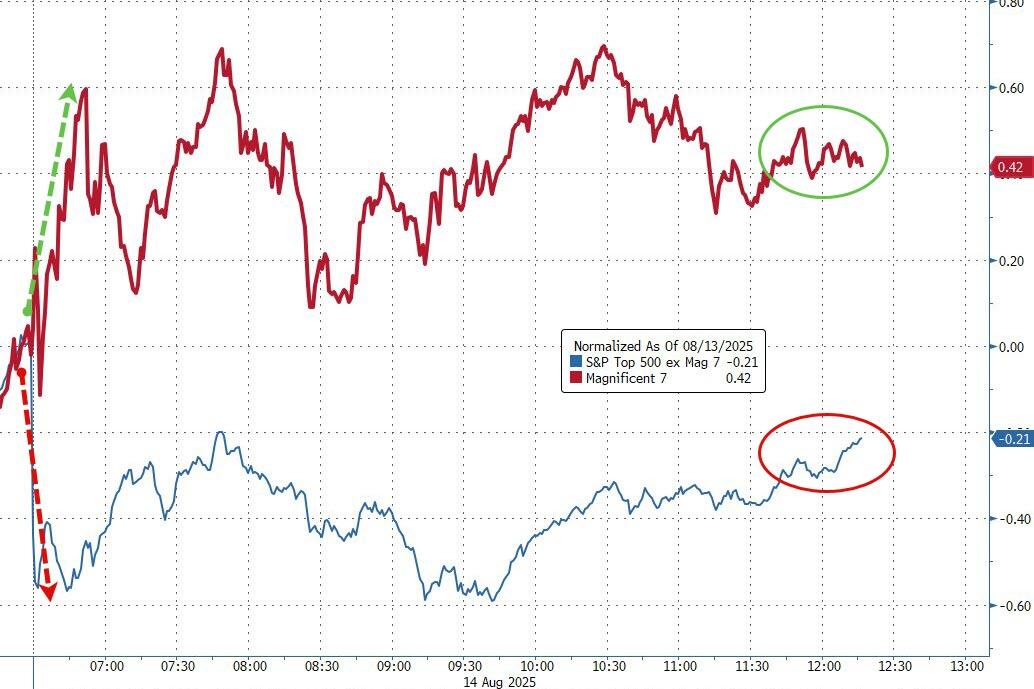
Despite the inflation scare, traders rotated back into big tech. Names like Nvidia, Amazon, and Microsoft helped the market recover from its worst levels, with the Mag7 stocks doing the heavy lifting once again.

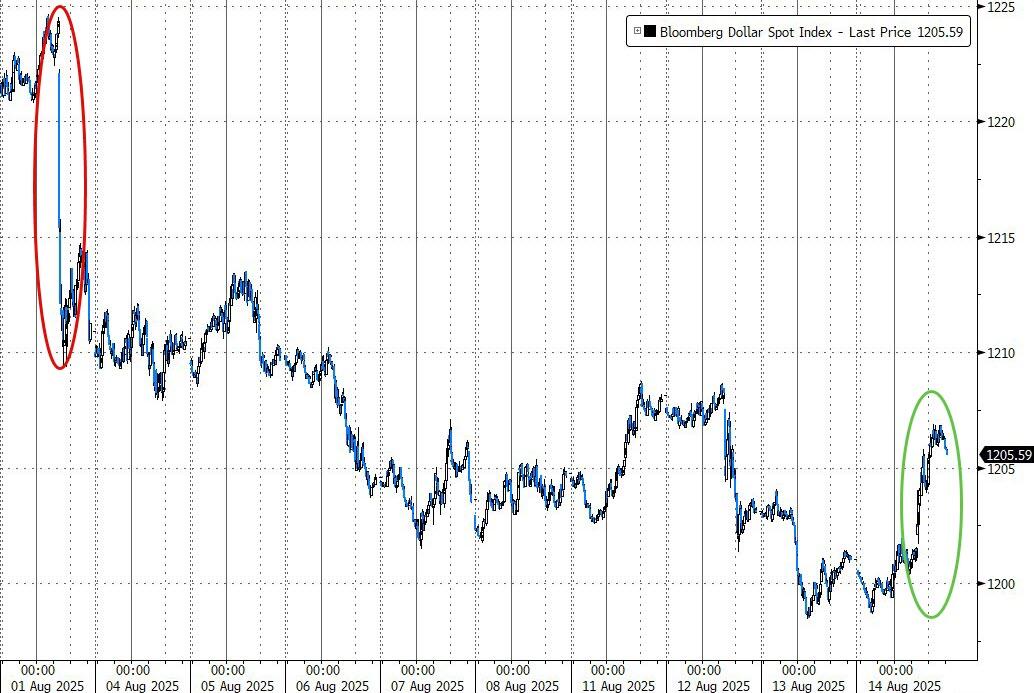
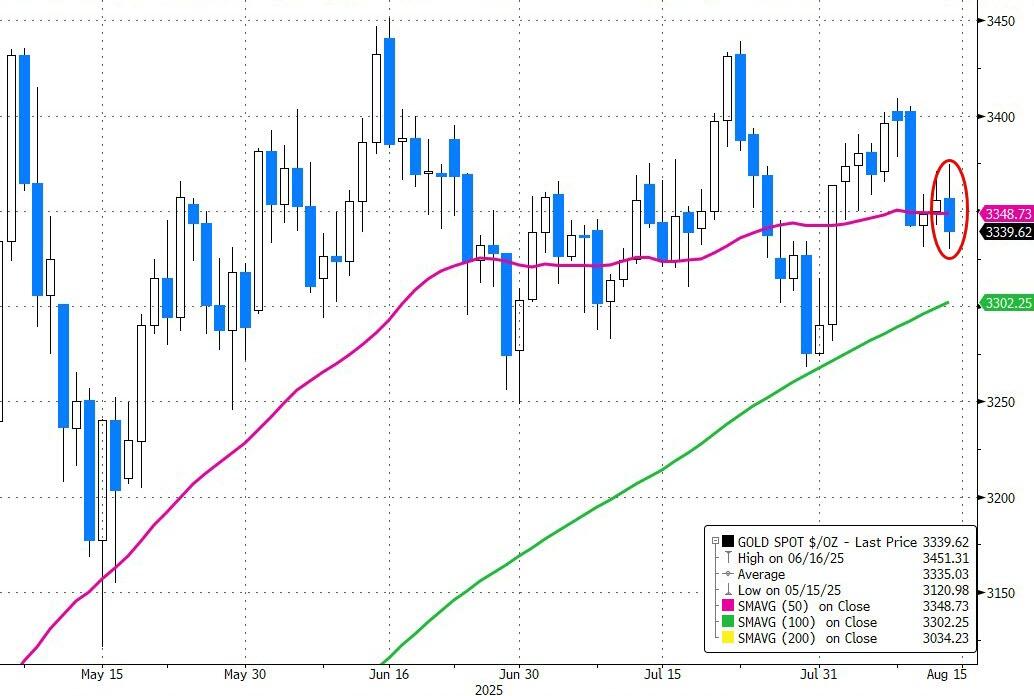
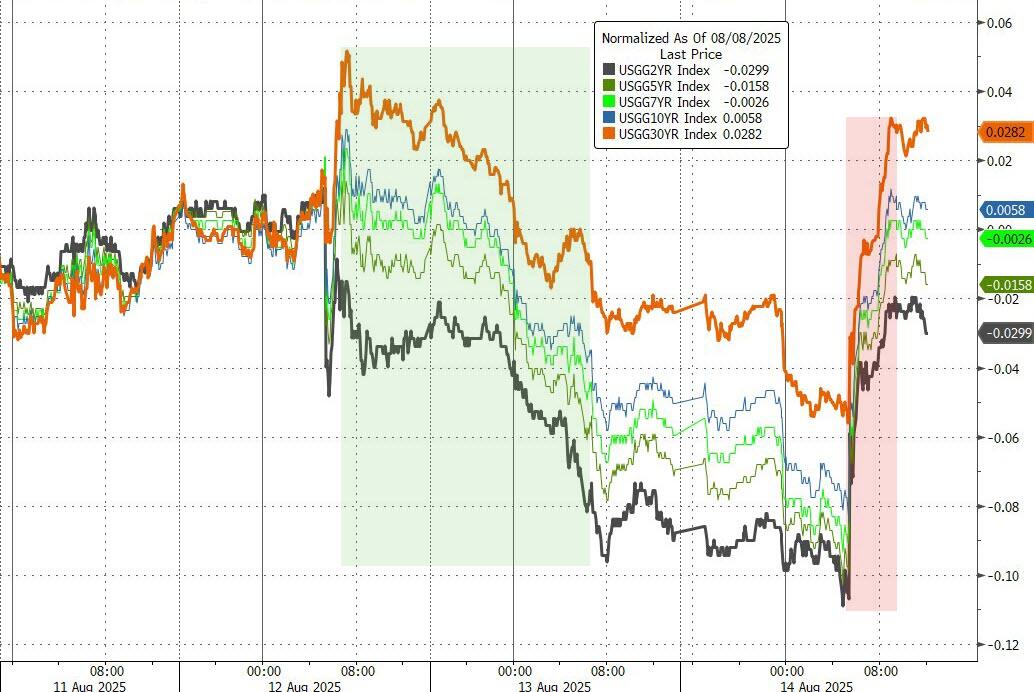
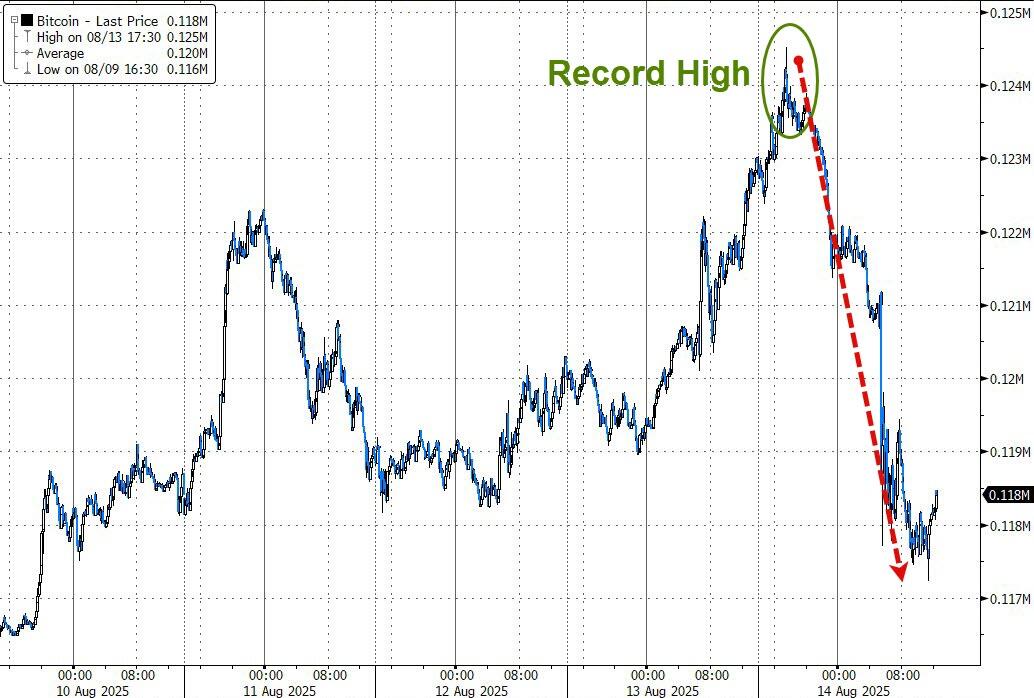
In the rest of the market, the dollar managed a bounce (though it still looks shaky after recent losses), gold slid below a key technical level, bond yields climbed, and Bitcoin came off last night’s record high but found solid footing around $118,000.

So, was today’s flat finish just a breather before the next big move—or are traders starting to question their conviction after these mixed inflation signals?

Read More

Bitcoin Nears New Highs As Markets Bet On Fed Cut Next Month

Ulli Market Commentary Contact

[Chart courtesy of MarketWatch.com]

  1. Moving the market

The post-CPI euphoria is still alive and well—stocks kept rallying to fresh all-time highs, led by the Dow while the Nasdaq lagged a bit behind. Tech didn’t sit out, though: AMD jumped more than 6% and Apple snuck in a 1% gain.

Today’s moves build on Tuesday’s record-setting session, which was supercharged by a cooler inflation report and sent rate-cut hopes through the roof. Traders are now basically convinced—pricing in a 99% chance—that the Fed will lower rates in September.

It’s not all about inflation, either: a surprisingly strong second-quarter earnings season is helping fuel the optimism. Earnings reports have slowed for a minute, but next week big retail names step up—so expect plenty of market buzz.

Looking ahead, tomorrow’s Producer Price Index (PPI) gives us another piece of the inflation puzzle, and all eyes are turning to the Fed’s annual Jackson Hole meeting (August 21–23) for clues on their next moves.

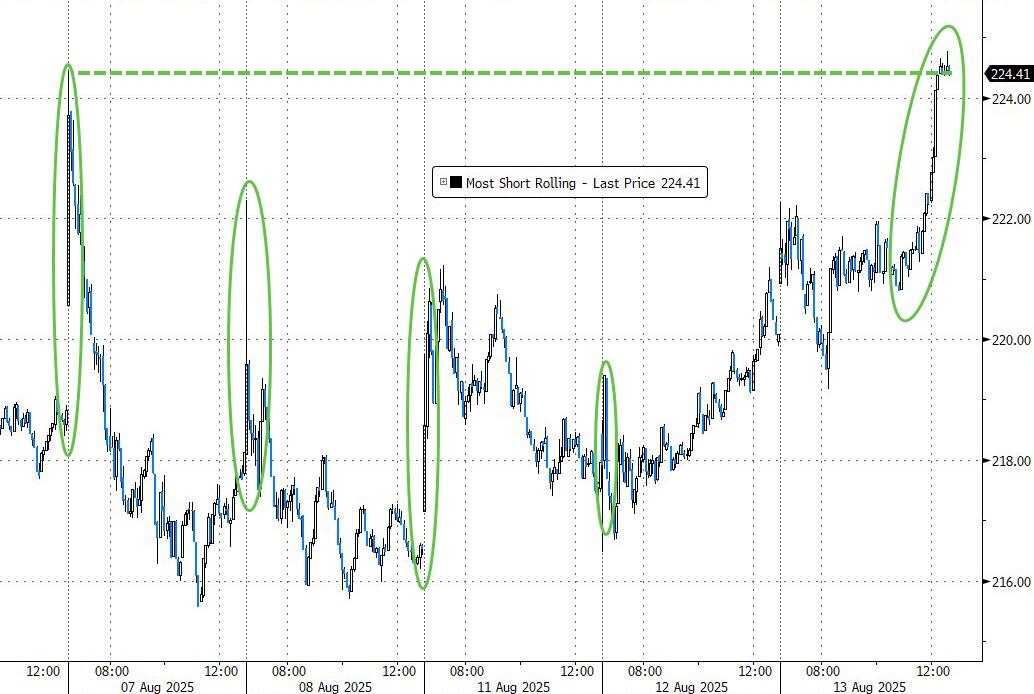
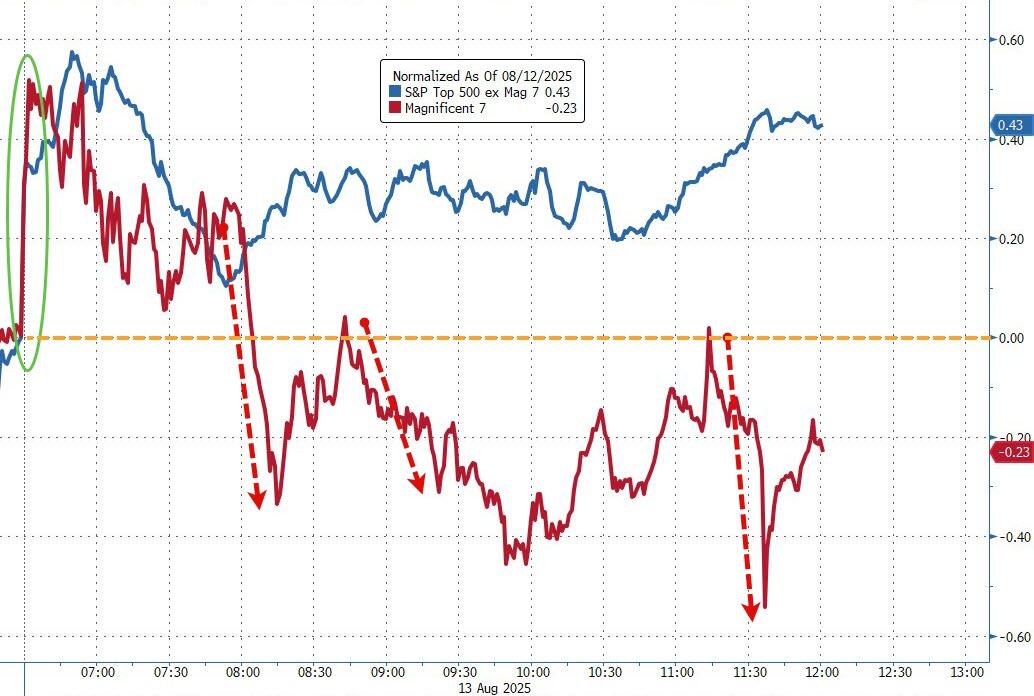
A big short squeeze pushed the whole market higher this afternoon, but interestingly, the Mag 7 stocks lagged most of the S&P 500.

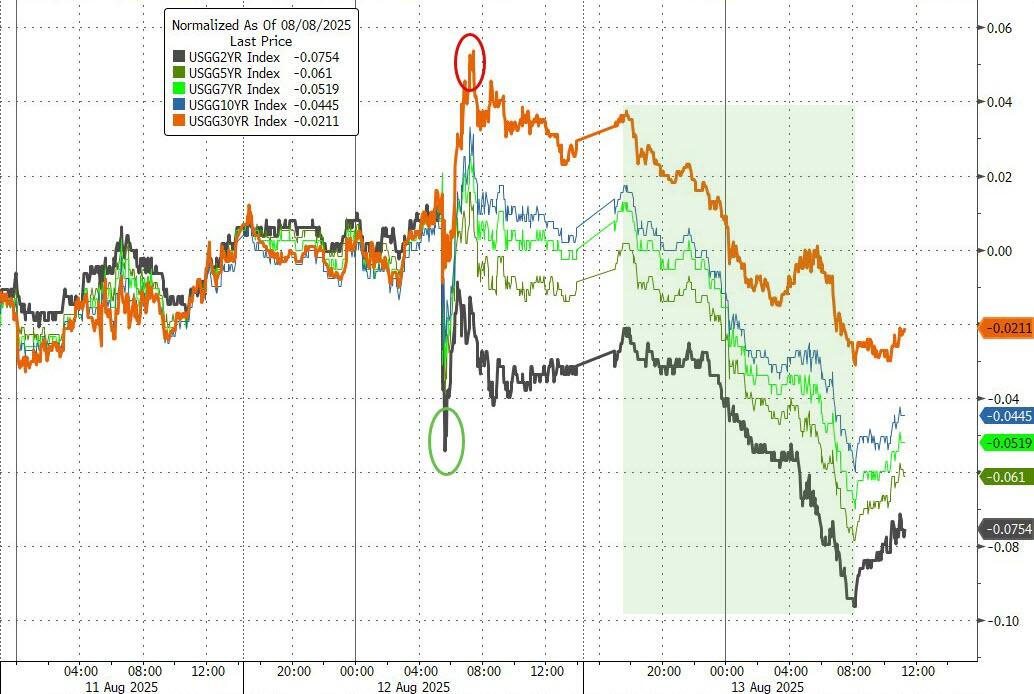
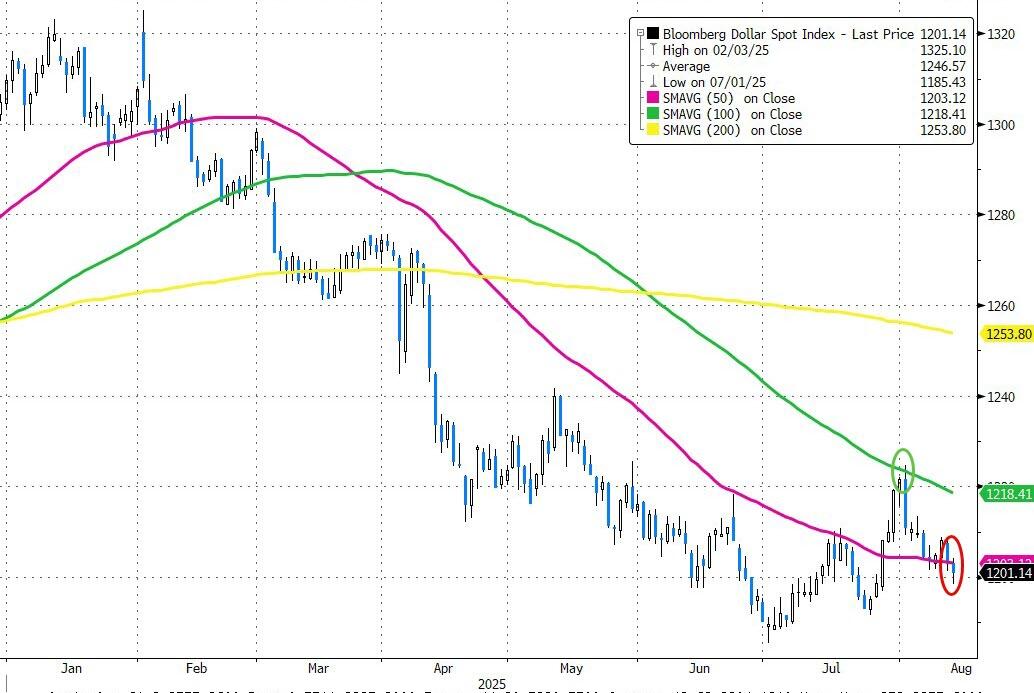
Bond yields slipped, the dollar dropped below a key level, and gold managed just a modest gain despite all that.

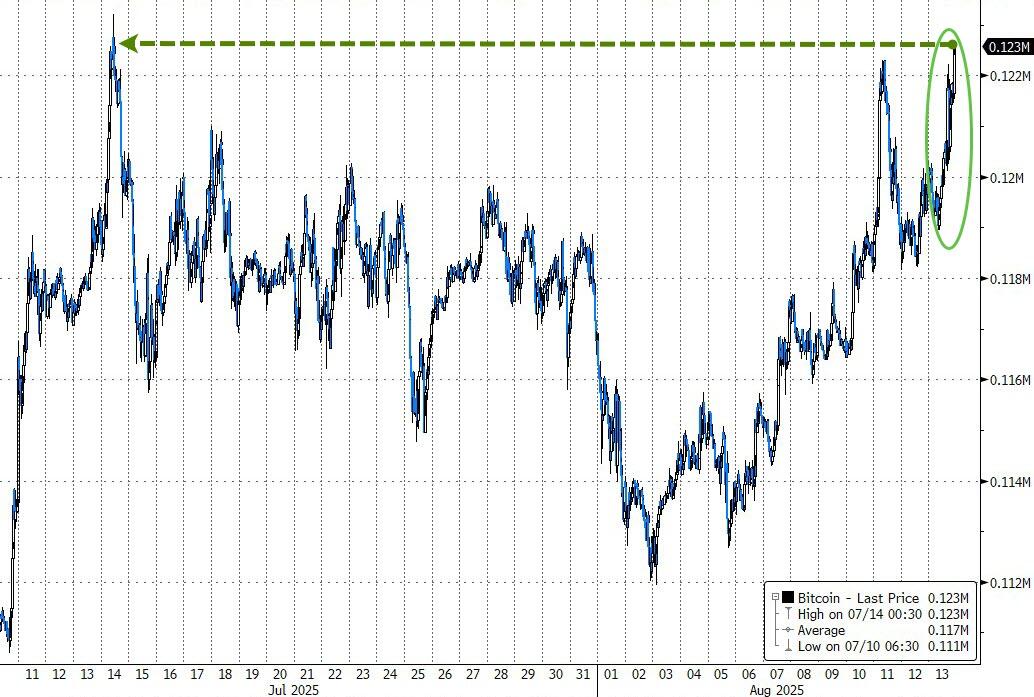
Bitcoin’s on a tear again, topping $122,000—maybe finally ready to hit a new all-time high.

With so much optimism and momentum, is this rally just getting started, or will the upcoming data or Fed chatter throw another curveball at the market?

Read More