Dead Cat Bounce Saves Indexes From Crashing

Ulli Market Commentary Contact

Mon pic

[Chart courtesy of MarketWatch.com]

1. Moving the Markets

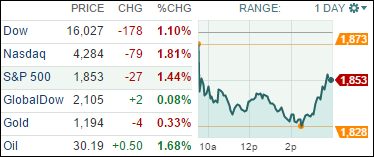
It it hadn’t been for a last hour turn-around, possibly a dead cat bounce, the major indexes may have headed for a steep dive. As it turned out, the worst was avoided for the time being, but this type of market action underscores what I have been saying since the middle of November—when our Domestic TTI broke below its long-term trend line—that a bear market has started and the only unknown is its magnitude and duration.

On the heels of Friday’s sell-off, the culprits remain the same in that crude oil continued its southerly path, European banks, especially Deutsche Bank, are in “fear” mode and, of course, the global economic slowdown has become all too real now.

Besides the Material Sector (-2.7%), Financials took a beating at the tune of -2.6%, however, energy was fairly resilient and closed up +0.1%. While the S&P 500 closed below its January closing low (1,859), it still remains above its January intra-day low of 1,812 which, once taken out will not bode well for equities in general. We’ll have to wait and see if and when we get there; in the meantime, I expect some rebound efforts followed by more downside moves.

9 of our 10 ETFs in the Spotlight headed south led by the Financials (IYF) with -2.63%. Only one survived the onslaught and that was the Dividend ETF (DVY), which actually managed to squeeze out a gain of +0.08%.

Read More

ETFs/Mutual Funds On The Cutline – Updated Through 02/05/2016

Ulli ETFs on the Cutline Contact

Below are the latest ETF Cutline reports, which show how far above or below their respective long-term trend lines (39 week SMA) my currently tracked ETFs/MFs are positioned.

The first report covers the ETF Master List from Thursday’s StatSheet and includes 381 ETFs, of which currently 40 (last week 38) are hovering in bullish territory.

The second report includes only High Volume ETFs. To clarify, High Volume (HV) ETFs are defined as those with an average daily volume of $10 million or higher. Volume figures can change in a hurry, so be sure to check first before investing.

These ETFs are generated from my selected list of 98 that I use in my advisor practice. It cuts out the “noise,” which simply means it eliminates those ETFs that I would never buy because of their volume limitations. 10 ETFs (last week 8) have managed to remain in bullish territory after the recent market volatility.

The third report covers Mutual Funds on the Cutline. There are currently 27 (last week 15) above the line and 754 below it out of the 781 that I follow.

Take a look:

  1. ETF Master Cutline Report
  2. ETF High Volume Cutline Report
  3. MF Cutline Report

In case you are not familiar with some of the terminology used in the reports, please read the Glossary of Terms.

If you missed the original post about the Cutline approach, you can read it here.

One Man’s Opinion: Are US Banks Well Capitalized?

Ulli Market Review Contact

ManThe US economy has been growing at 2 percent real and perhaps 2.9 percent nominal for the past several years, said Bill Gross, portfolio manager at Janus Capital Group.

Japan is above the (recession) line and euro-land seems to have come out of their recession; so easy monetary policy is working a little bit, but central banks’ philosophy remains questionable. Their age old economic models that suggest the lower the interest rates are driven, the better it gets because asset prices go up and the wealth effect gets disseminated down the real economy, but the economy getting normal does not seem to be working for a number of reasons.

The rush for more and more negative interest rates could have negative consequences as it affects business models of insurance companies and pension funds. Ultimately it affects savers; if savers don’t earn a return of their money, then saving diminishes and investment languishes, he noted.

Read More

New ETFs On The Block: Guggenheim Dow Jones Industrial Average Dividend ETF (DJD)

Ulli Dividend ETFs Contact

InvestingAmid heightened market volatility and slumping Treasury yields, many investors have started to believe lower rates will linger for a bit longer, meaning dividend plays could make hay for an extended period while the Fed falters. Such a scenario may look ideal for a strategically timed new smart-beta product from Guggenheim Investments.   
The newly launched Guggenheim Dow Jones Industrial Average Dividend ETF (DJD) is weighted based on the dividend yields of the 30 stocks in the index. While the Dow Jones Industrial Average index remains one of the most popular indices in the world, it’s also one of the most maligned.

Created in 1896 by Charles Dow, the blue-chip benchmark follows a price weighting mechanism, which means the priciest stock in the index also gets the maximum weight. Not fundamentals. Not market capitalization. That also means price volatility of Goldman Sachs weighs more on the index despite the fact that Apple Inc, also a Dow component, has more than seven times the market capitalization of Goldman.

Read More

ETF/No Load Fund Tracker Newsletter For February 5, 2016

Ulli ETF Tracker Contact

ETF/No Load Fund Tracker StatSheet

————————————————————-

THE LINK TO OUR CURRENT ETF/MUTUAL FUND STATSHEET IS:

https://theetfbully.com/2016/02/weekly-statsheet-for-the-etfno-load-fund-tracker-newsletter-updated-through-02042016/

————————————————————

Market Commentary

INDEXES PLUNGE WITH NASDAQ CRASHING 3%

Fri pic

[Chart courtesy of MarketWatch.com]

1. Moving the Markets

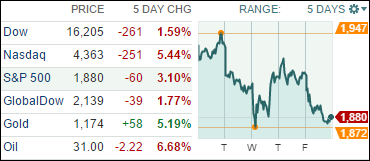
The major indexes headed south right out of starting blocks with the jobs report confirming the old mantra that good news is bad news, which caused concerns on Wall Street that the Fed could be increasing its interest rate hike cycle this year producing a bearish outcome for equities.

To be clear, the jobs report was OK on the surface but, as has been the case as of late, most newly created jobs came in the minimum wage and part-time arena, hardly the stuff that solid recoveries are made of. Still, unemployment dropped to 4.9% mainly due to the slumping labor participation rate.

The big loser of the day and the week was the Nasdaq, which surrendered over 5% during the last five trading sessions. Big names have been heading south all week, but the mother of all losses was taken today by LinkedIn (LNKD), which got slaughtered at the tune of -44%.

Needless to say, all of our 10 ETFs in the Spotlight slipped as well with Consumer Discretionaries (XLY) getting crushed the most by surrendering -3.23%. To no surprise, the conservative Consumer Staples ETF (XLP) held up very well and gave back on -0.16%.

Read More

Weekly StatSheet For The ETF/No Load Fund Tracker Newsletter – Updated Through 02/04/2016

Ulli ETF StatSheet Contact

ETF/Mutual Fund Data updated through Thursday, February 4, 2016

TOC010716

If you are not familiar with some of the terminology used, please see the Glossary of Terms.


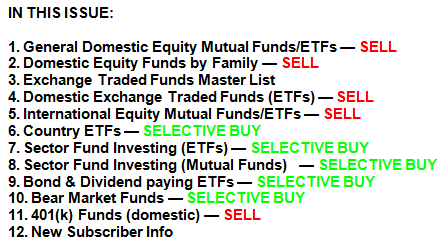
1. DOMESTIC EQUITY MUTUAL FUNDS/ETFs: SELL — since 11/13/2015

TTI

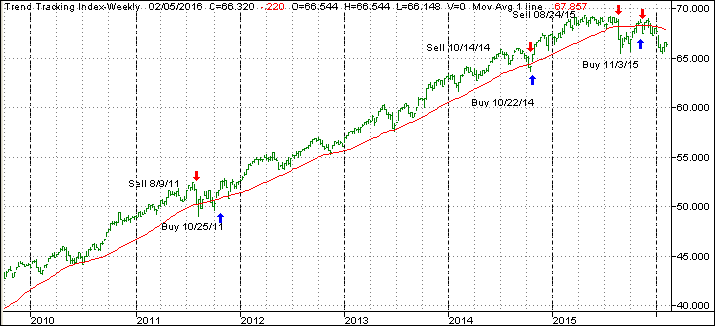
Our main directional indicator, the Domestic Trend Tracking Index (TTI-green line in above chart) has recently crawled above its long term trend line (red) and finally generated a new “Buy” signal effective 11/3/15. The market subsequently dropped, and we exited again on 11/13/15. As of today, the TTI remains below its trend line by -2.36%, which means we are in cash on the sidelines.

Read More