
1. Moving the Markets
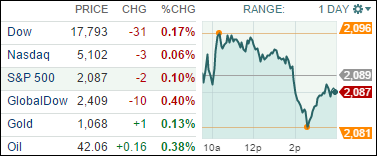
Wall Street, coming off its best weekly gain of the year, which was preceded by its worst one, kicked off the Holiday-shortened week in a cautious mood, as investors digested a record deal in the pharmaceutical space and kept a close eye on Europe, where the terrorism threat remains real.
It seems to me that Wall Street is in a tug of war at the moment, with the market benefiting from what has historically been a good seasonal period for stocks, but being held back by a market driven by just a handful of stocks, geopolitical risks and continued price pressures in the commodities space. At the same time, we are close to reaching the upper end of the trading range for he S&P 500 and need to see whether this glass ceiling will be broken or not.
U.S. Crude Oil dropped about 2.84% today to close at just under $40 a barrel. This means that prices could remain under $2 a gallon throughout most of the country this week.
In M&A news today, pharmaceutical giants Pfizer (PFE) and Allergan (AGN) are on the verge of announcing the largest healthcare merger in history. The merger would allow Pfizer to transfer its headquarters from the U.S.A. to Ireland. The $160 billion deal has raised eyebrows about the tax-saving strategy it entails, but it appears at present that the deal will reach the finish line.
6 of our 10 ETFs in the Spotlight closed up led by Consumer Staples (XLP) with +0.88%, while the downside leader was the Global 100 (IOO) sporting a loss of -0.60%.
2. ETFs in the Spotlight
In case you missed the announcement and description of this section, you can read it here again.
It features 10 broadly diversified ETFs from my HighVolume list as posted every Monday. Furthermore, they are screened for the lowest MaxDD% number meaning they have been showing better resistance to temporary sell offs than all others over the past year.
Here are the 10 candidates:
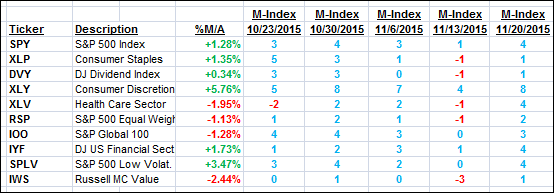
The above table simply demonstrates the magnitude with which some of the ETFs are fluctuating in regards to their positions above or below their respective individual trend lines (%M/A). A break below, represented by a negative number, shows weakness, while a break above, represented by a positive percentage, shows strength.
For hundreds of ETF/Mutual fund choices, be sure to reference Thursday’s StatSheet.
Year to date, here’s how the above candidates have fared so far:
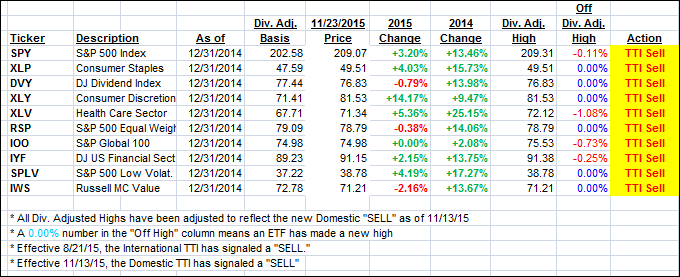
Again, the first table above shows the position of the various ETFs in relation to their respective long term trend lines (%M/A), while the second one tracks their trailing sell stops in the “Off High” column. The “Action” column will signal a “Sell” once the -7.5% point has been taken out in the “Off High” column.
3. Trend Tracking Indexes (TTIs)
Our Domestic Trend Tracking Index (TTI) changed only immaterially and had not effect on our current bearish position.
Here’s how we closed:
Domestic TTI: +0.46% (last close +0.42%)—Sell signal effective 11/13/2015
International TTI: -3.27% (last close -3.12%)—Sell signal effective 8/21/2015
Disclosure: I am obliged to inform you that I, as well as advisory clients of mine, own some of these listed ETFs. Furthermore, they do not represent a specific investment recommendation for you, they merely show which ETFs from the universe I track are falling within the guidelines specified.
Contact Ulli