Weekly StatSheet For The ETF/No Load Fund Tracker Newsletter – Updated Through 05/12/2016

Ulli ETF StatSheet Contact

ETF/Mutual Fund Data updated through Thursday, May 12, 2016

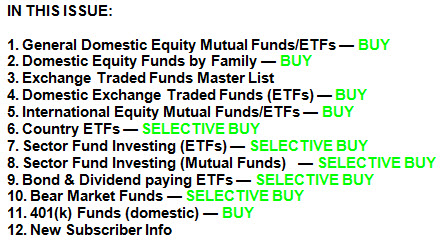
TOC042816

If you are not familiar with some of the terminology used, please see the Glossary of Terms.


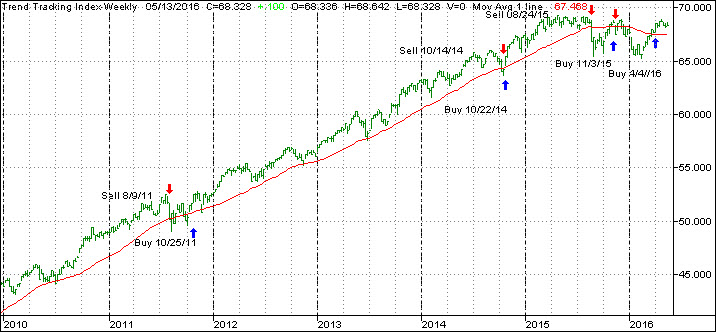
1. DOMESTIC EQUITY MUTUAL FUNDS/ETFs: BUY — since 4/4/2016

TTI

Our main directional indicator, the Domestic Trend Tracking Index (TTI-green line in above chart) has recently crossed above its long term trend line (red) by +1.26% generating a new Domestic Buy signal effective 4/4/2016 as posted on the blog.

Read More

Treading Water

Ulli Market Commentary Contact

Thur pic

[Chart courtesy of MarketWatch.com]

1. Moving the Markets

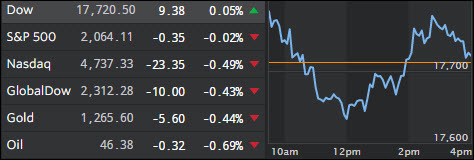
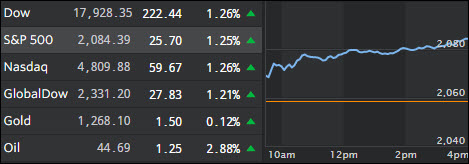
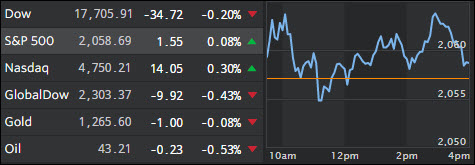
It was a mixed day as the the above intra-day chart of the S&P 500 shows. Dancing above and below its unchanged line and ending 0.02% lower isn’t exactly a sign of a strong bull market.

The Nasdaq fared the worst as Apple got clobbered again tumbling to a two-year low producing a heavy drag on the major indexes. Worries about slowing demand for iPhones were seen as the culprit.

There seems to be a lack of conviction in the market by both, buyers and sellers as the economy grinds along without making any headway. Retailers have been suffering with the latest casualty being Nordstrom with their disaster earnings announcement after hours. As I am writing this, the stock is getting clobbered at the tune of -17%. Ouch…

Read More

Disney Miss Brings Down Dow

Ulli Market Commentary Contact

Wed pic

[Chart courtesy of MarketWatch.com]

1. Moving the Markets

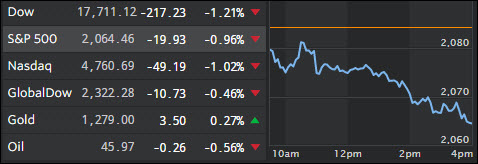
After posting its biggest daily gain since March 1, the Dow’s upward move did not last too long and the warm fuzzy feeling from yesterday dissipated in a hurry.

Hitting the markets today, was the news that Staples (SPLS) decided to bail on its $6.3 billion acquisition of Office Depot (ODP) after a federal judge blocked a merger bid. Apparently, the judge sided with regulators that a joining of the two companies could impair competition in the near future. Shares of Staples fell more than 17%.

Another big downer for the Dow was that Q1 earnings from Disney (DIS) missed for the first time in five years. Subsequently, the news pushed Disney shares down 4.0% to $102.29. Disney’s big loss was responsible for the bulk of the Dow’s decline today.

U.S. Crude Oil maintained its recent rise to close at $46.07 per barrel. The commodity keeps pushing towards the $50 mark and oil bulls are hoping that the economy will hit that mark by summer time. Given massive production increases worldwide, slowing demand and overflowing storage facilities, I would not hold my breath for that one.

Read More

Volatile Monday; Solid Tuesday!

Ulli Market Commentary Contact

Tue pic

[Chart courtesy of MarketWatch.com]

1. Moving the Markets

After a volatile session to kick off the week Monday, U.S. stocks surged today as Wall Street attempts to gauge the market’s next move amid a recent stall in momentum after a sizable rally off of the lows in February. If you are looking for a reason to support the rally, there wasn’t any as economic data remains week, earnings haven’t gone anywhere but oil and bonds are in rally mode.

Investors are trying to figure out where to put their money, as the February rush has faded to the fullest. Heading into today’s session, earnings for the S&P 500 are on track to contract 5.5% in Q1, which would mark the third straight quarter of negative growth. Wall Street seems to still be hoping betting on an earnings recovery in the second half of the year though.

Overall, rebounding oil prices in recent months have given the stock market a lift, but in recent days trading in the black gold has become volatile. The price of a barrel of U.S.-produced crude has been a consistent pendulum in and out of positive territory on a daily basis. Today though, U.S. Crude Oil closed up 2.90% at $44.79 a barrel.

Looking at the following chart, courtesy of ZH, the S&P 500 remains in nosebleed territory and disconnected from US Macro and bond yields. A picture is worth a thousand words:

Read More

Markets Remain In Limbo

Ulli Market Commentary Contact

Mon pic

[Chart courtesy of MarketWatch.com]

1. Moving the Markets

The U.S. stock market, currently riding a two-week losing streak amid signs of fading momentum after a big rally off the market lows back in February, kicked off the new week with mixed results and little signs of breaking out to the upside.

Oil dropped a bit, there was some news on the M&A side and tech stocks remain strong.

While there’s no economic data releases of importance set for release this week, Wall Street will watch the tail-end of the Q1 earnings season, which has been weak, but not as bad as feared, which was simply a function of sharply reduced expectations. With 438 of the 500 S&P companies having already reported, earnings are seen contracting “only” 5.1%, which is far better than the 8% slide forecast at the start of the reporting season.

In M&A news today, we head that Krispy Kreme Doughnuts (KKD), the chain famous for its simple glazed pleasure will be acquired by JAB Beech, a subsidiary of investment firm JAB Holdings Company. The deal is valued at $1.35 billion and JAB Beech will pay $21 a share in cash for Krispy Kreme, which is a 25% premium over the company’s Friday closing stock price of $16.86. The deal will turn Krispy Kreme into a private company and is expected to close in Q3 of this year.

Read More

ETFs/Mutual Funds On The Cutline – Updated Through 05/06/2016

Ulli ETFs on the Cutline Contact

Below are the latest ETF Cutline reports, which show how far above or below their respective long-term trend lines (39 week SMA) my currently tracked ETFs/MFs are positioned.

The first report covers the ETF Master List from Thursday’s StatSheet and includes 381 ETFs, of which currently 263 (last week 300) are hovering in bullish territory.

The second report includes only High Volume ETFs. To clarify, High Volume (HV) ETFs are defined as those with an average daily volume of $10 million or higher. Volume figures can change in a hurry, so be sure to check first before investing.

These ETFs are generated from my selected list of 98 that I use in my advisor practice. It cuts out the “noise,” which simply means it eliminates those ETFs that I would never buy because of their volume limitations. 62 ETFs (last week 81) have managed to remain in bullish territory after the recent market volatility.

The third report covers Mutual Funds on the Cutline. There are currently 290 (last week 367) above the line and 490 below it out of the 780 that I follow.

Take a look:

  1. ETF Master Cutline Report
  2. ETF High Volume Cutline Report
  3. MF Cutline Report

In case you are not familiar with some of the terminology used in the reports, please read the Glossary of Terms.

If you missed the original post about the Cutline approach, you can read it here.