ETFs/Mutual Funds On The Cutline – Updated Through 06/03/2016

Ulli ETFs on the Cutline Contact

Below are the latest ETF Cutline reports, which show how far above or below their respective long-term trend lines (39 week SMA) my currently tracked ETFs/MFs are positioned.

The first report covers the ETF Master List from Thursday’s StatSheet and includes 381 ETFs, of which currently 344 (last week 338) are hovering in bullish territory.

The second report includes only High Volume ETFs. To clarify, High Volume (HV) ETFs are defined as those with an average daily volume of $10 million or higher. Volume figures can change in a hurry, so be sure to check first before investing.

These ETFs are generated from my selected list of 98 that I use in my advisor practice. It cuts out the “noise,” which simply means it eliminates those ETFs that I would never buy because of their volume limitations. 86 ETFs (last week 80) have managed to remain in bullish territory after the recent market volatility.

The third report covers Mutual Funds on the Cutline. There are currently 588 (last week 322) above the line and 192 below it out of the 780 that I follow.

Take a look:

  1. ETF Master Cutline Report
  2. ETF High Volume Cutline Report
  3. MF Cutline Report

In case you are not familiar with some of the terminology used in the reports, please read the Glossary of Terms.

If you missed the original post about the Cutline approach, you can read it here.

Note: As posted last week, the “ETFs/Mutual Funds On The Cutline” report has been moved from Mondays to Saturdays so that you can use the information over the weekend in preparation of any trades you plan on making. Many readers had requested this change.

ETF/No Load Fund Tracker Newsletter For June 3, 2016

Ulli ETF Tracker Contact

ETF/No Load Fund Tracker StatSheet

————————————————————-

https://theetfbully.com/2016/06/weekly-statsheet-for-the-etfno-load-fund-tracker-newsletter-updated-through-06022016/

————————————————————

Market Commentary

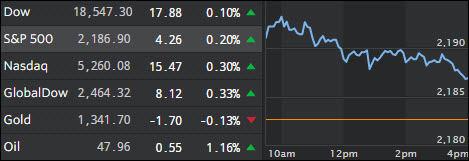
STOCKS IN RED AFTER DISAPPOINTING JOBS FIGURE

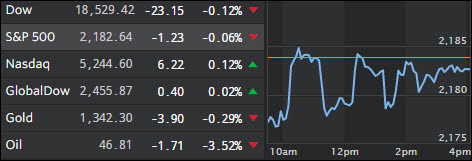
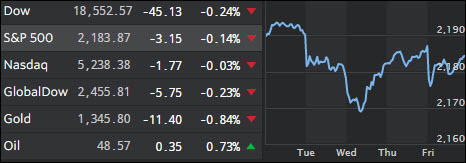
Fri pic

[Chart courtesy of MarketWatch.com]

1. Moving the Markets

The “big” jobs report that analysts and investors alike were eyeing came in lower than expected, to say it politely; actually it was a total dud. 160,000 jobs were expected…and the survey says…38,000. The numbers are of course sub-par and will likely re-ignite worries among investors as to the trajectory of the U.S. economy heading into the summer.

At the same time, the numbers for the past two months were revised and actually 59,000 less than reported. Hmm, makes me wonder if the next month’s upcoming revision reduces jobs into negative territory for the month of May.

A slowing job market is not only bad news for U.S. workers, but could also force investors to re-think the Fed’s position on hiking interest rates in the coming months. Quotes from Yellen over the past have given prelude to a potential June rate hike and all eyes were on the jobs report today. Well, these numbers pretty much should have killed any ambition for June.

It will be interesting to see how the market responds next week once the reality of these numbers has sunk in. After the initial sell-off this morning, the major indexes were manipulated higher to control any downside damage. To my way of thinking, eventually there has to be a realization that while low interest rates are a positive by giving an assist to the markets, the fact that they are so low because of slowing or non-existent organic growth in the economy will be a negative in the long run.

Read More

Weekly StatSheet For The ETF/No Load Fund Tracker Newsletter – Updated Through 06/02/2016

Ulli ETF StatSheet Contact

ETF/Mutual Fund Data updated through Thursday, June 2, 2016

TOC051916

If you are not familiar with some of the terminology used, please see the Glossary of Terms.


1. DOMESTIC EQUITY MUTUAL FUNDS/ETFs: BUY — since 4/4/2016

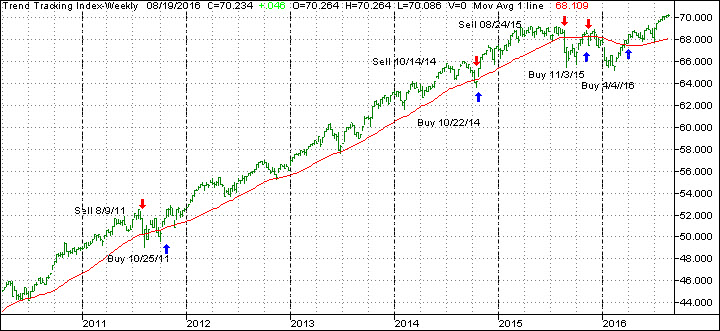
TTI

Our main directional indicator, the Domestic Trend Tracking Index (TTI-green line in above chart) remains above its long term trend line (red) by +2.14% after having generated a new Domestic Buy signal effective 4/4/2016 as posted.

Read More

Markets Gain Despite OPEC Turmoil

Ulli Market Commentary Contact

Thur pic

[Chart courtesy of MarketWatch.com]

1. Moving the Markets

OPEC and oil were the largest market movers today. Imagine my surprise when news came in during mid-day trading that OPEC was not able to seal a deal on capping oil production. The failure to reach a decision underscores the increasingly conflicted interests within the organization. Two members in particular, Saudi Arabia and Iran, are currently in a geopolitical standoff, and analysts say neither country wants to yield market share to the other. The price of U.S. Crude closed at $49 a barrel.

Resurfacing in the news today was more info on Microsoft’s (MSFT) failed acquisition of Nokia (NOK). Microsoft has said that it will lay off up to 1,850 jobs and write down $950 million on its balance sheet. This news largely indicates that the company is going to drop its pursuit of manufacturing smart phones and remain focused on software development.

Wall Street remains focused on the extremely important May jobs report that is slated for release tomorrow. It is important, or course, because the Fed has bluntly stated that the performance of the U.S. economy will dictate a move to raise interest rates in the near future. Analysts are expecting about 160,000 jobs to have been created during May.

We all know that the markets are manipulated and that Fed announcements in regards to possible interest hikes, or lack thereof, determine market direction. Fundamentals no longer matter—until one day they do. So when did this disconnect actually get started?

ZeroHedge had an interesting chart attempting to answer that question. Take a look:

Read More

Is June Gloom Looming?

Ulli Market Commentary Contact

Wed pic

[Chart courtesy of MarketWatch.com]

1. Moving the Markets

Stocks spent much of the day in the red as Wall Street reacted to sub-par economic data out of China. China’s official purchasing manager’s index for manufacturing was inline with forecasts at 50.1, but that is a dangerous place to be because any number below 50 indicates a contacting economy.

The month of May is best known for the saying, “Sell in May and go away.” That old saying was smudged as stocks gained solidly to round out the month despite the seasonal headwinds that typically accompany May. Of course, this feat was only accomplished with the help of the Fed, who managed interest rate hike speculations well enough to keep the major indexes in the green.

June also usually entails bearish sentiment, mostly due to its poor performance history. Economic data points today were downright dismal with automakers having the second highest inventory in 23 years as GM sales plunged 18%, while sales of Ford and Lincoln passenger cars dropped an amazing 25 percent, which was led by a 37 percent slide for the Taurus sedan.

Let’s keep an eye on commodities and Fed minutes as the month unfolds, as markets remain very reactionary to these two indicators. And, of course, the all important Brexit later on when British voters head to the booths to determine whether Great Britain will stay in the Eurozone or not. If not, expect some fireworks affecting not only Europe stocks but U.S. equities as well. In that scenario, June gloom might be looming.

Read More

May Marks 3rd Straight Positive Month

Ulli Market Commentary Contact

Tue pic

[Chart courtesy of MarketWatch.com]

1. Moving the Markets

Although markets did little to impress in the first day of trading after the holiday weekend, the gains from last week were enough to maintain a positive month overall for May. This marks the third straight month of gains for the S&P 500 for a grand total of +1.8%.

Today, we heard mixed news on consumer health here in the U.S. April income rose 0.4% and spending jumped 1%, which was more than analysts’ had forecast. However, consumer confidence in May disappointed. The Conference Board reported that the May confidence reading came in at 92.6, below April’s 94.7 level and below the May estimate of 96.1. Manufacturing contracted and Chicago PMI came in below expectations; nothing but weak data that might not give the Fed the warm fuzzies when considering a rate hike later this month.

During May, stocks got a hearty lift from oil surging above $50 per barrel for the first time since October. The $50 per barrel target price is something to keep an eye on as we head towards the summer months unless, of course, oil prices collapse again like they did last summer.

Later this week, Wall Street will be closely watching a key monetary policy meeting of the ECB and an OPEC gathering, although analysts don’t expect any announcement on oil production cuts in the imminent future.

Read More