
1. Moving the Markets
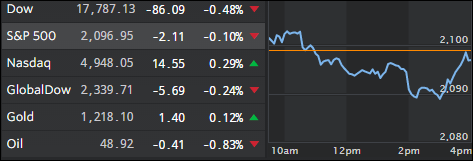
Although markets did little to impress in the first day of trading after the holiday weekend, the gains from last week were enough to maintain a positive month overall for May. This marks the third straight month of gains for the S&P 500 for a grand total of +1.8%.
Today, we heard mixed news on consumer health here in the U.S. April income rose 0.4% and spending jumped 1%, which was more than analysts’ had forecast. However, consumer confidence in May disappointed. The Conference Board reported that the May confidence reading came in at 92.6, below April’s 94.7 level and below the May estimate of 96.1. Manufacturing contracted and Chicago PMI came in below expectations; nothing but weak data that might not give the Fed the warm fuzzies when considering a rate hike later this month.
During May, stocks got a hearty lift from oil surging above $50 per barrel for the first time since October. The $50 per barrel target price is something to keep an eye on as we head towards the summer months unless, of course, oil prices collapse again like they did last summer.
Later this week, Wall Street will be closely watching a key monetary policy meeting of the ECB and an OPEC gathering, although analysts don’t expect any announcement on oil production cuts in the imminent future.
2. ETFs in the Spotlight
In case you missed the announcement and description of this section, you can read it here again.
It features 10 broadly diversified ETFs from my HighVolume list as posted every Monday. Furthermore, they are screened for the lowest MaxDD% number meaning they have been showing better resistance to temporary sell offs than all others over the past year.
Here are the 10 candidates:
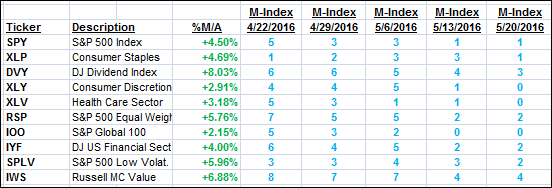
The above table simply demonstrates the magnitude with which some of the ETFs are fluctuating in regards to their positions above or below their respective individual trend lines (%M/A). A break below, represented by a negative number, shows weakness, while a break above, represented by a positive percentage, shows strength.
For hundreds of ETF/Mutual fund choices, be sure to reference Thursday’s StatSheet.
Year to date, here’s how the above candidates have fared so far:
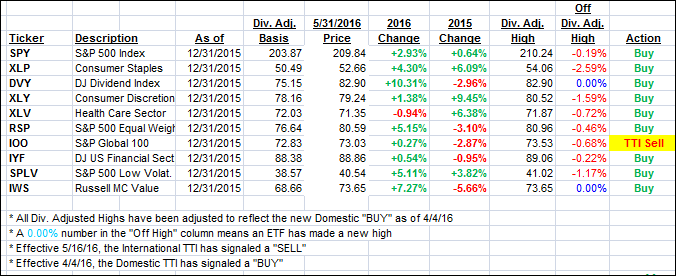
Again, the first table above shows the position of the various ETFs in relation to their respective long term trend lines (%M/A), while the second one tracks their trailing sell stops in the “Off High” column. The “Action” column will signal a “Sell” once the -7.5% point has been taken out in the “Off High” column.
3. Trend Tracking Indexes (TTIs)
Our Domestic Trend Tracking Index (TTI) barely changed after the last trading day of March offered mostly a sideways pattern.
In regards to the International TTI, my theme remains the same in that I want to see more staying power above the line before issuing a new “BUY” so that we can limit the odds of another whip-saw signal.
Here’s how we closed this month:
Domestic TTI: +1.90% (last close +1.88%)—Buy signal effective 4/4/2016
International TTI: +1.13% (last close +1.18%)—Sell signal effective 5/16/2016
Disclosure: I am obliged to inform you that I, as well as advisory clients of mine, own some of these listed ETFs. Furthermore, they do not represent a specific investment recommendation for you, they merely show which ETFs from the universe I track are falling within the guidelines specified.
Contact Ulli