ETFs/Mutual Funds On The Cutline – Updated Through 07/22/2016

Ulli ETFs on the Cutline Contact

Below are the latest ETF Cutline reports, which show how far above or below their respective long-term trend lines (39 week SMA) my currently tracked ETFs/MFs are positioned.

The first report covers the ETF Master List from Thursday’s StatSheet and includes 381 ETFs, of which currently 506(last week 332) are hovering in bullish territory.

The second report includes only High Volume ETFs. To clarify, High Volume (HV) ETFs are defined as those with an average daily volume of $10 million or higher. Volume figures can change in a hurry, so be sure to check first before investing.

These ETFs are generated from my selected list of 98 that I use in my advisor practice. It cuts out the “noise,” which simply means it eliminates those ETFs that I would never buy because of their volume limitations. 81 ETFs (last week 83) have managed to remain in bullish territory after the recent market volatility.

The third report covers Mutual Funds on the Cutline. There are currently 730(last week 711) above the line and 50 below it out of the 780 that I follow.

Take a look:

  1. ETF Master Cutline Report
  2. ETF High Volume Cutline Report
  3. MF Cutline Report

In case you are not familiar with some of the terminology used in the reports, please read the Glossary of Terms.

If you missed the original post about the Cutline approach, you can read it here.

ETF/No Load Fund Tracker Newsletter For July 22, 2016

Ulli ETF Tracker Contact

ETF/No Load Fund Tracker StatSheet

————————————————————-

https://theetfbully.com/2016/07/weekly-statsheet-for-the-etfno-load-fund-tracker-newsletter-updated-through-07212016/

————————————————————

Market Commentary

S&P 500 NOTCHES 7TH RECORD HIGH FRIDAY DESPITE SOUR ‘POST-BREXIT’ DATA

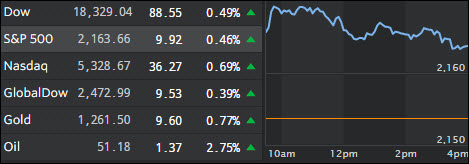
Fri chart

[Chart courtesy of MarketWatch.com]

1. Moving the Markets

Overall, it was a great week for the market here in the U.S. The S&P 500 hit a fresh record high today (its seventh this year) a day after the Dow fell from a nine-day run, wherein also notched a record high this week  It seems investors are keeping their eyes on quarterly earnings reports and the release of the first post-Brexit economic data from Britain and Europe.

The surge higher for U.S. stocks has been driven in part by a decent start to the Q2 earnings season, as reports are coming in better than originally feared but are still negative. Heading into today’s trading session, 67% of the 103 companies that have reported in the S&P 500 have topped results, which is above the long-term average of 63%.

In addition to getting fresh earnings today from names like General Electric (GE) and Honeywell (HON),  both which failed to impress what was forecasted, Wall Street is also digesting fresh manufacturing data from Europe and Britain, the first such data since the so-called ‘Brexit’ vote last month.

Again, as I have repeatedly posted, the Fed is no longer data dependent in its planned actions but is only concerned with propping up asset markets to keep the illusion of the recovery alive. Even a former governor has now admitted as much. While that theme can go on for a while, eventually it will end up badly as a correction to fair market value will have to occur; the uncertainty is just the timing of it. That’s why we always need to be aware and prepared to head for the exit doors once market behavior dictates such a move.

Read More

Weekly StatSheet For The ETF/No Load Fund Tracker Newsletter – Updated Through 07/21/2016

Ulli ETF StatSheet Contact

ETF/Mutual Fund Data updated through Thursday, July 21, 2016

TOC072116

If you are not familiar with some of the terminology used, please see the Glossary of Terms.

Important announcement: Please note that I am in process of expanding the ETF portion of the StatSheet to bring you a wider variety of High Volume ETFs. I will be discontinuing the mutual fund portion, which I have a featured as a courtesy only for many years. Times are changing and ETFs are the product of the future. To further assist those having to invest in mutual funds with their 401ks, I will post access to a “mutual fund to ETF converter.” This change is scheduled to take effect around the end of July.

1. DOMESTIC EQUITY MUTUAL FUNDS/ETFs: BUY — since 4/4/2016

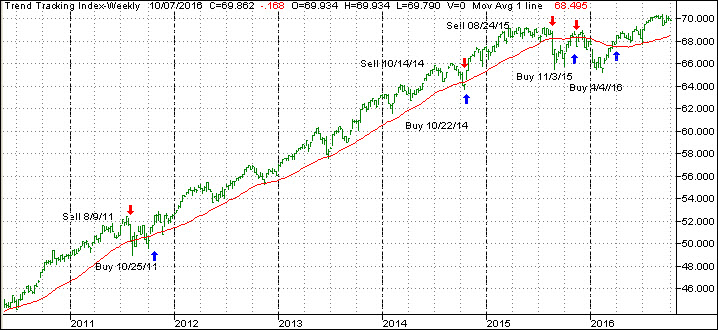
TTI

Our main directional indicator, the Domestic Trend Tracking Index (TTI-green line in above chart) remains above its long term trend line (red) by +2.73% after having generated a new Domestic Buy signal effective 4/4/2016 as posted.

Read More

Winning Streak Snaps; Markets Pause

Ulli Market Commentary Contact

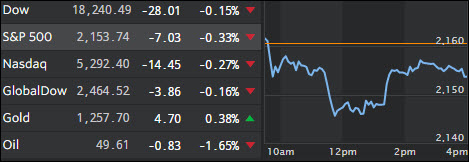
thur pic

[Chart courtesy of MarketWatch.com]

1. Moving the Markets

As you know, the Dow has been riding the bull for 9 day continued winning streak that hasn’t happened in three years. Unfortunately, that streak snapped today due to mixed earning reports here in the U.S. and an announcement from the European Central bank that they will hold off on additional stimulus following last month’s ‘Brexit’ vote.

The Dow, which notched its seventh straight record high Wednesday, was dragged down today by Intel (INTC), whose shares fell more than 4.3% after the company’s revenue fell short of estimates in its quarterly results released last night. Shares of American Express (AXP), another Dow component, were also trading 2.1% lower after a similar revenue miss.

In auto earnings news, we heard today that General Motors (GM) turned a profit of $2.9 billion in Q2, which easily surpassed Wall Street’s expectations. Notable drivers of sales growth were increased earnings in China and the Americans, whose citizens continued buying expensive trucks, sport-utility vehicles and crossovers.

On the economic front, existing home sales rose, jobless claims surprisingly contracted and the Leading Indicator topped forecasts. Crude oil and the U.S. dollar headed south while gold staged a nice rebound after showing weakness during the past week.

Read More

Dow Inches Up While Tech Stocks Lead

Ulli Market Commentary Contact

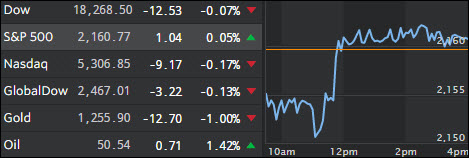
Wed pic

[Chart courtesy of MarketWatch.com]

1. Moving the Markets

The Dow continued blazing a trail today, bolstered by a strong earnings report from tech giant Microsoft (MSFT). The index continues to plow its way into record territory and lately there’s no sign of it doing otherwise. The nine-day winning streak is its longest since a 10-session rally more than three years ago in March 2013.

The Dow and S&P 500 have been moving higher in the past week due to a better-than-expected start to Q2 earnings season, which, of course, was based on sharply reduced expectations to begin with to make the actual numbers look better. This rally is hardly based on improving economic fundamentals but more so a function of central bank intervention to keep the dream of a recovery alive. After all, if that was not so, why would bond yields signal a recession in the making? As a result, the continued Bull Run is merely a reflection of investor optimism that central bankers (CBs) around the world will continue to support the markets with fiscal stimulus. Once either optimism or CB support ends, watch out below!

Microsoft’s earnings report blew the hats off of investors as it surpassed profit estimates by 16 cents per share. The strong results from the tech giant, which is best known for its software, were more correlated to this quarter’s strong performance from its cloud computing division. Shares gained 5.3% on the day.

Morgan Stanley (MS) also bested expectations today via both profit and revenue results. Shares closed 2.1% higher.

Read More

Markets Reacting Awkward Despite Solid Earnings Reports

Ulli Market Commentary Contact

Tue pic

[Chart courtesy of MarketWatch.com]

1. Moving the Markets

Stocks ended mixed today, apart from the Dow, which climbed for an eighth straight day and notched a new closing high.

While the S&P 500 closed in the red today, don’t forget that the index is coming off another record high recently, and both the S&P 500 and the Dow are now up more than 6% for the year.

Second quarter earnings season is fully underway and we heard from some big market movers today. Goldman Sachs (GS), Johnson & Johnson (JNJ), IBM (IBM) and United Healthcare (UNH) all posted numbers that beat sharply reduced earnings expectations.

Shares of Goldman Sachs, which topped analyst forecasts by nearly 70 cents per share, fell 1.3%. J&J stock, which also topped analyst forecasts rose 1.7% higher and IBM slid lower after solid earnings. This begs the question as to just how much share price movement is really tied to earnings reports…

One of the big entertainment market movers, Netflix (NFLX), missed big on its earnings report and shares of the stock fell accordingly, -13% approximately. The company only added 1.7 million new subscribers from April through June, which was significantly below the 2.5 million they were expecting. The company blamed their lackluster numbers on people cancelling their memberships at a higher rate than expected.

Read More