Slightly Higher—But Speculation Still Looms

Ulli Market Commentary Contact

Mon pic

[Chart courtesy of MarketWatch.com]

1. Moving the Markets

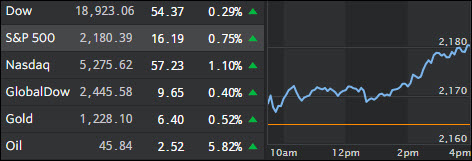
U.S. stocks closed higher Monday and the Dow broke a 3-day losing streak, even as investors continue to calculate the odds of a (potential) Federal Reserve interest-rate hike later this year.

Much of the focus throughout Wall Street has remained on the trajectory of interest rates, which have not increased for eight months, despite much speculation.

Federal Reserve Chair Janet Yellen said last Friday (in a highly-anticipated speech) that the case for an increase had “strengthened,” leaving open the door for an increase at the Fed’s September or December meetings.  The ‘market moving’ event was already priced in apparently, given that the markets came out positive today.

From the world of retail:  J. Crew’s vibrant collection of women’s wear will soon be available inside department store chain Nordstrom (JWN), as the struggling apparel brand looks for ways to get customers spending again.  A partnership with Nordstrom aligns with the company’s customer service strategy of emphasizing design, quality and style, which appeals to most Nordstrom customers.

In energy, U.S. Crude Oil closed down slightly lower today at $46.95 a barrel, which remains well under the $50 a barrel cap that most analysts were projecting for the summer months.  Now that the summer months are over, it shall be interesting to see not only how prices move throughout the fall but if the correlation with the S&P 500 is maintained.

Read More

One Man’s Opinion: Central Banks Are Terrified… But of What?

Ulli Market Review Contact

OneMan'sOpinionby Phoenix Capital

A quick question for the “recovery” enthusiasts…

If the recovery is real and as strong as the “data” suggests… why are Central Banks engaged in the most aggressive stimulus in history?

Consider Europe.

According to the official data, the EU’s Services and Manufacturing PMI’s were 53.1 and 51.8 in August. Both were significantly above 50 (which represents contraction)…

Moreover, the EU’s inflation rate has risen over 0.4% in four months, rising from -0.2% in April to 0.2% today.

And yet, despite this data, the ECB continues to hold interest rates at -0.4% while also spending €80 billion per month in QE (the equivalent of $90 billion). At this pace, the ECB will spend nearly €1 TRILLION IN QE PER YEAR.

Read More

ETFs On The Cutline – Updated Through 08/26/2016

Ulli ETFs on the Cutline Contact

Below please find the latest High Volume ETF Cutline report, which shows how far above or below their respective long-term trend lines (39 week SMA) my currently tracked ETFs are positioned.

This report covers the HV ETF Master List from Thursday’s StatSheet and includes 366 High Volume ETFs ETFs, defined as those with an average daily volume of more than $5 million, of which currently 323 (last week 329) are hovering in bullish territory. The yellow line separates those ETFs that are positioned above their trend line from those that have dropped below it.

Take a look:

The HV ETF Master Cutline Report  

In case you are not familiar with some of the terminology used in the reports, please read the Glossary of Terms.

If you missed the original post about the Cutline approach, you can read it here.

ETF Tracker Newsletter For August 26, 2016

Ulli ETF Tracker Contact

ETF Tracker StatSheet

————————————————————-

https://theetfbully.com/2016/08/weekly-statsheet-for-the-etf-tracker-newsletter-updated-through-08252016/

————————————————————

Market Commentary

YELLEN SPEAKS, BUT WAS ALREADY PRICED IN

Fri pic

[Chart courtesy of MarketWatch.com]

1. Moving the Markets

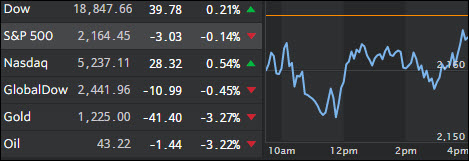
As I have been stating throughout the week, one of the main market moving events that was on deck has been an anticipated speech from Janet Yellen, which took place today.  The speech was well-received and did (once again) indicate the possibility of an interest-rate hike later this year; however, it appears that the possibility of that hike has (for the most part) been baked into markets already.

Thus, the market’s tepid reaction suggests that investors may have priced in the likelihood of an interest-rate increase, though few expect it to occur at the Fed’s September meeting…December is more likely, but who knows? Being non-committal and vague are the hallmarks of Fed communications.

In thinking about the economy in general, the Commerce Department reported today that U.S. GDP rose 1.1% in the second quarter, below a previous estimate of 1.2%.  The global economic slowdown and oil’s slide have undermined economic activity, but what has kept the economy afloat have been the allegedly solid employment figures YTD.

With the summer winding down, it is now time to look towards the fall quarter.  Economic figures for Q2 are wrapped up and we have three months to follow the markets and see what is going to the big movers and the shakers.

Read More

Weekly StatSheet For The ETF Tracker Newsletter – Updated Through 08/25/2016

Ulli ETF StatSheet Contact

ETF Data updated through Thursday, August 25, 2016

TOC082516

Methodology/Use of this StatSheet:

  1. From the universe of over 1,800 ETFs, I have selected only those with a trading volume of over $5 million per day (HV ETFs), so that liquidity and a small bid/ask spread are assured.
  2. Trend Tracking Indexes (TTIs)

Buy or Sell decisions for Domestic and International ETFs (section 1 and 2), are made based on the respective TTI and its position either above or below its long-term M/A (Moving Average). A crossing of the trend line from below accompanied by some staying power above constitutes a “Buy” signal. Conversely, a clear break below the line constitutes a “Sell” signal. Additionally, I use a 7.5% trailing stop loss on all positions in these categories to control downside risk.

  1. All other investment arenas do not have a TTI and should be traded based on the position of the individual ETF relative to its own respective trend line (%M/A). That’s why those signals are referred to as a “Selective Buy.” In other words, if an ETF crosses its own trendline to the upside, a “Buy” signal is generated. Since these areas tend to be more volatile, I recommend a wider trailing sell stop of 7.5% -10% depending on your risk tolerance.

If you are unfamiliar with some of the terminology, please see Glossary of Terms and new subscriber information in section 9.


 1. DOMESTIC EQUITY ETFs: BUY — since 4/4/2016

TTI

Our main directional indicator, the Domestic Trend Tracking Index (TTI-green line in the above chart) remains above its long-term trend line (red) by +2.88% after having generated a new Domestic Buy signal effective 4/4/2016 as posted.

Read More

Laying In Waiting For Yellen Speech

Ulli Market Commentary Contact

Thur pic

[Chart courtesy of MarketWatch.com]

1. Moving the Markets

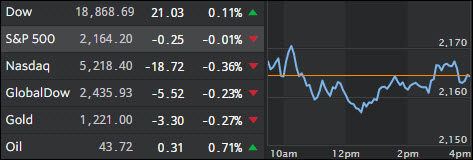
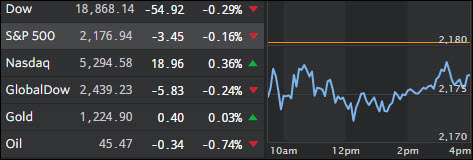
Heading into Thursday’s trading session, all three major U.S. stock indexes were less than 1% below their record closing highs.  Equities dipped slightly lower today though ahead of another much anticipated speech due from Janet Yellen tomorrow in Jackson Hole, WY. Many believe that Yellen wants to avoid market turbulence, so a surprise policy shift toward a sooner-than-expected rate hike is unlikely.

As usual, the speech is being chalked up as must-see TV, but Federal Reserve chair Janet Yellen’s address Friday may not offer many (or even any) surprises at all.  Yellen is expected to outline what “tools” the Fed has to fight the next battle or crisis that may come up as it comes to grips with the new world of slow growth and low rates. However, no matter how much lipstick you want to put on that pig, the only “tool” the Fed has at its disposal is to create more debt no matter what they call it. That’s it!

On the individual stock front, shares of drug maker Mylan (MYL) were up in early trading after the company responded to the controversy surrounding a sharp price hike on its EpiPen by offering consumers a rebate in the form of a savings coupon that the company says will cut the cost of the drug in half.  Shares pulled back late in the day low and closed down about 0.8%.

Read More