
ETF Tracker StatSheet
Market Commentary
Coming Off The Pre-Fed Higs
- Moving the Markets
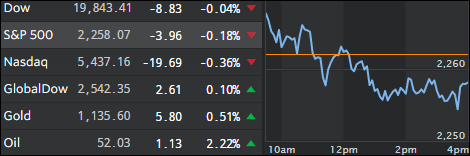
Equities slipped today as upward momentum started to wane after Tuesday’s pre-Fed rally. For the week, the S&P 500 gave back 2 points, which makes it just about an unchanged performance.
Today’s weakness was the result of several events. On the economic side, some geopolitical tensions surfaced as a Chinese Navy warship seized an underwater drone deployed by an American oceanic vessel, which was operating in international waters of the South China Sea.
In the corporate world, Deutsche Bank admitted that it misled investors and violated securities laws and agreed to pay more than $40 million to settle charges. But, of course, as is customary these days, the fine takes the place of any prison term.
On the economic front, housing starts and permits crashed in November 18.7% MoM, almost the biggest monthly plunge since 2005. And just one day after China halted trading in bond futures for the first time ever, today’s news that it failed to sell all T-Bills to be auctioned for the first time in 18 months, indicates that bond traders are concerned that interest rates could spike much higher in the future.
And that could be the canary in the coalmine that will eventually derail the equity markets as I posted yesterday. The key is to watch bond yields which can serve as an early warning sign of things to come in the wide world of stocks. Here’s another chart that makes this abundantly clear:
 click on chart to enlarge
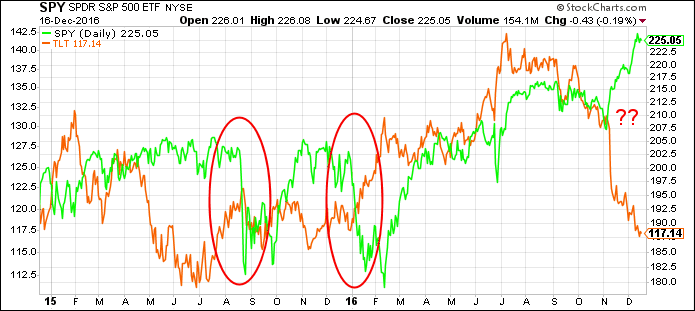
I have charted the S&P 500 (SPY) vs. the 20-year bond ETF (TLT). Please note the 2 red ovals showing what happens after bonds (orange) fall (meaning yields rise). SPY (green) follows suit and can even overshoot to the downside as it did in February 2016.
To the far right, you can see the current disconnect, which will have to correct itself at some point. A further yield spike past the 2.75% mark in 10-year bonds (not shown) will most likely pull equities off their lofty levels.
What could prevent such a fall? A rally in bonds (meaning a collapse in yields) would do the trick and could save equities for the time being. Which will it be?
- ETFs in the Spotlight
In case you missed the announcement and description of this section, you can read it here again.
It features 10 broadly diversified ETFs from my HighVolume list as posted every Monday. Furthermore, they are screened for the lowest MaxDD% number meaning they have been showing better resistance to temporary sell offs than all others over the past year.
Here are the 10 candidates:
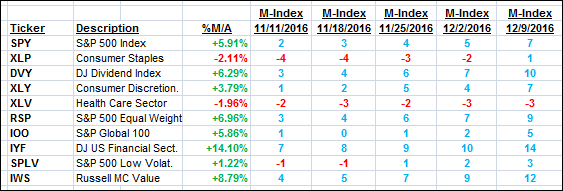
The above table simply demonstrates the magnitude with which some of the ETFs are fluctuating in regards to their positions above or below their respective individual trend lines (%M/A). A break below, represented by a negative number, shows weakness, while a break above, represented by a positive percentage, shows strength.
For hundreds of ETF choices, be sure to reference Thursday’s StatSheet.
Year to date, here’s how the above candidates have fared so far:
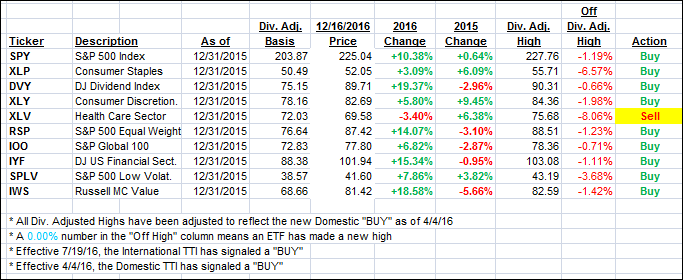
Again, the first table above shows the position of the various ETFs in relation to their respective long term trend lines (%M/A), while the second one tracks their trailing sell stops in the “Off High” column. The “Action” column will signal a “Sell” once the -7.5% point has been taken out in the “Off High” column.
- Trend Tracking Indexes (TTIs)
Our Trend Tracking Indexes (TTIs) went nowhere as the S&P 500 lost 2 points for the week.
Here’s how we closed 12/16/2016:
Domestic TTI: +1.11% (last Friday +1.57%)—Buy signal effective 4/4/2016
International TTI: +2.85% (last Friday +3.50%)—Buy signal effective 7/19/2016
Have a great weekend.
Ulli…
Disclosure: I am obliged to inform you that I, as well as my advisory clients, own some of the ETFs listed in the above table. Furthermore, they do not represent a specific investment recommendation for you, they merely show which ETFs from the universe I track are falling within the guidelines specified.
————————————————————-
READER Q & A FOR THE WEEK
All Reader Q & A’s are listed at our web site!
Check it out at:
https://theetfbully.com/questions-answers/
———————————————————-
WOULD YOU LIKE TO HAVE YOUR INVESTMENTS PROFESSIONALLY MANAGED?
Do you have the time to follow our investment plans yourself? If you are a busy professional who would like to have his portfolio managed using our methodology, please contact me directly or get more details at:
https://theetfbully.com/personal-investment-management/
———————————————————
Back issues of the ETF/No Load Fund Tracker are available on the web at:
https://theetfbully.com/newsletter-archives/
Contact Ulli