Financials Provide A Last Minute Boost

Ulli Market Commentary Contact

[Chart courtesy of MarketWatch.com]
  1. Moving the Markets

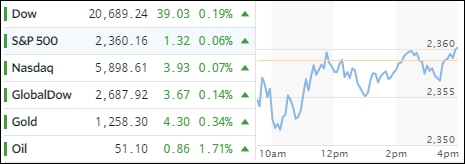
It’s been no secret that the post-election rally hit a speed bump with the S&P 500 having moved within a 4 point range, on a closing basis, for the past 2 weeks. Anxiety continues to prevail as to whether Trump can really deliver on his campaign promises.

Retail shares were the anchor weighing on the S&P and Nasdaq early on but the financials (+0.8%) proved to be the savior of the day pushing the indexes up late in the session. Giving the assist was Fed chair Yellen opining in a speech that it “makes sense” to gradually lift interest rates. However, the Dow closed at 2017 lows pulled down by Healthcare and telecommunications.

The higher rates theme shifted things into reverse with the dollar rallying, after taking a drubbing over the past few days, while the winner year-to-date, gold, retreated. Bonds closed lower as interest rates rose. I expect this sideways pattern to continue until Trump has been inaugurated this Friday. Next week, with the election soap opera finally behind us, we may hopefully see better directional clues for the market. The big unknown is whether it will be up or down.

Read More

Indexes Slip On Trump And Brexit Uncertainty

Ulli Market Commentary Contact

[Chart courtesy of MarketWatch.com]
  1. Moving the Markets

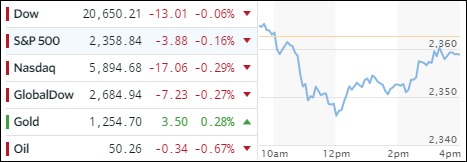
Uncertainty gripped the markets as remarks from President-elect Trump about the dollar being too strong pulled the starch out of any upside momentum, and the major indexes spent the session below their unchanged lines with the S&P 500 losing a modest -0.30%.

Not helping equities were remarks from U.K. Prime Minister May detailing Brexit plans, which sparked a huge rally in the British Pound. As the Dollar weakened, interest rates pulled back with the 20+ year T-Bond ETF (TLT) rallying +1.05%, which in turn put pressure on the Financials (IYF), which dropped -1.55% for the day. Even better-than-expected quarterly earnings from Morgan Stanley (MS) could not stem the slide.

The clear winner of the day was gold, which gained $19.40, or 1.62%, breaking back above the $1,200 level. This post-election equity rally was in part based on the surging dollar, which moved very much in sync with the S&P 500. And then this happened:

Read More

One Man’s Opinion: The Equation That Explains It All

Ulli Market Review Contact

OneMan'sOpinionAuthored by Mark St.Cyr,

If you were just woken from some form of suspended animation from let’s say 2010 (ancient economic history in today’s terms) then informed of the current state of global political affairs and upheavals, U.S. employment (95+million not,) global currency gyrations, interest rates at not only 0% but some -0%, threats of escalating wars, threats of major confrontational war, GDP of the major global economies not only contracting, but below statistical stagnant, governments, as well as central banks with balance sheets of debt calculated in $TRILLIONS, some in the 10’s of, all financed at near or below 0%, and the Fed is only about a week away from raising rates into the teeth of what can only be called “uncertainty,” and much, much more. (There isn’t enough time, or digital ink to list them all.)

Nobody would be surprised if your first reaction based on your prior acumen (the ancient history of 7 years ago whether it be in stocks, business, or both) would to become immediately concerned that whatever portfolio, or wealth you may have had in the markets, may be worth far less today than when you were first put to sleep. And probably becoming ever smaller as you thought about what you might need to do next in order to preserve any that may be left.

Read More

ETFs On The Cutline – Updated Through 01/13/2017

Ulli ETFs on the Cutline Contact

Below please find the latest High Volume ETFs Cutline report, which shows how far above or below their respective long-term trend lines (39 week SMA) my currently tracked ETFs are positioned.

This report covers the HV ETF Master List from Thursday’s StatSheet and includes 366 High Volume ETFs ETFs, defined as those with an average daily volume of more than $5 million, of which currently 237 (last week 234) are hovering in bullish territory. The yellow line separates those ETFs that are positioned above their trend line from those that have dropped below it.

Take a look:

The HV ETF Master Cutline Report            

In case you are not familiar with some of the terminology used in the reports, please read the Glossary of Terms.

If you missed the original post about the Cutline approach, you can read it here.

ETF Tracker Newsletter For January 13, 2017

Ulli ETF Tracker Contact

ETF Tracker StatSheet

https://theetfbully.com/2017/01/weekly-statsheet-for-the-etf-tracker-newsletter-updated-through-01122017/

Banks Pumped And Dumped

Fri pic

[Chart courtesy of MarketWatch.com]
  1. Moving the Markets

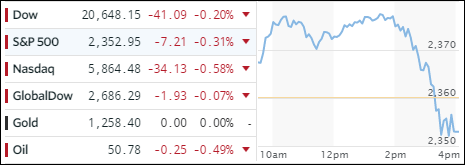
Facebook’s 1.36% gain, the result of a stock upgrade by Raymond James, helped push the Nasdaq into record territory; the Dow faded below the unchanged line, and the S&P 500 managed to inch +0.18% higher for the day but gave back -0.1% for the week.

The major banks kicked off earnings season with good results with shares initially surging. The trend reversed later in the session, as banks stocks dumped but managed to end up on the plus side for the day with Wells Fargo closing +1.36% higher while JP Morgan added +0.53%.

The Dow’s tiny dip was caused by heavyweight Wal Mart along with other consumer stocks ending to the downside after reports showed that retail sales increased less than expected during the Holiday season.

According to Reuters, the S&P 500 is trading at 17 times expected earnings which, compared to its 10-year average of 14, leaves plenty of room for a pullback should the Trump euphoria wear thin over the next few weeks. Nevertheless, with the markets being manipulated, and no longer being dependent on fundamentals, I expect another attempt being made at Dow 20k next week before inauguration day on January 20th.

Read More

Weekly StatSheet For The ETF Tracker Newsletter – Updated Through 01/12/2017

Ulli ETF StatSheet Contact

ETF Data updated through Wednesday, January 12, 2017

TOC082516

Methodology/Use of this StatSheet:

  1. From the universe of over 1,800 ETFs, I have selected only those with a trading volume of over $5 million per day (HV ETFs), so that liquidity and a small bid/ask spread are assured.
  2. Trend Tracking Indexes (TTIs)

Buy or Sell decisions for Domestic and International ETFs (section 1 and 2), are made based on the respective TTI and its position either above or below its long-term M/A (Moving Average). A crossing of the trend line from below accompanied by some staying power above constitutes a “Buy” signal. Conversely, a clear break below the line constitutes a “Sell” signal. Additionally, I use a 7.5% trailing stop loss on all positions in these categories to control downside risk.

  1. All other investment arenas do not have a TTI and should be traded based on the position of the individual ETF relative to its own respective trend line (%M/A). That’s why those signals are referred to as a “Selective Buy.” In other words, if an ETF crosses its own trendline to the upside, a “Buy” signal is generated. Since these areas tend to be more volatile, I recommend a wider trailing sell stop of 7.5% -10% depending on your risk tolerance.

If you are unfamiliar with some of the terminology, please see Glossary of Terms and new subscriber information in section 9.


  1. DOMESTIC EQUITY ETFs: BUY — since 4/4/2016

TTIClick on chart to enlarge

Our main directional indicator, the Domestic Trend Tracking Index (TTI-green line in the above chart) is positioned above its long-term trend line (red) by +1.63% after having generated a new Domestic Buy signal effective 4/4/2016 as posted.

Read More