Clinging To A Tiny Gain

Ulli Market Commentary Contact

[Chart courtesy of MarketWatch.com]
  1. Moving the Markets

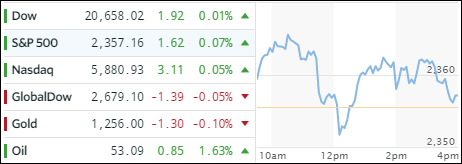
We started the week on a positive note when suddenly the markets took a dive below the unchanged line, crawled back above it and then closed with a tiny gain. Stocks were spooked on news reports that China had amassed some 150,000 troops along the North Korean border, which was enough to take the starch out of this rally.

Not helping matters were Secretary of State Tillerson’s remarks that the military strikes against Syria regarding its alleged use of chemical weapons were a warning signal to other nations, like N. Korea, as saber rattling was elevated to the next level.

Energy shares managed to gain with oil adding +1.63% offsetting some of the losses in the financial sector, as we are waiting for the earnings season to start this week. The 10-year Treasury yield went nowhere and slipped 1 point while the 30-year lost its 3% milestone and closed at 2.99%. The US dollar bobbed and weaved within a tight range and ended up surrendering -0.16%.

Read More

One Man’s Opinion: FOMC Admits The Stock Market Is A Bubble, Along With Many Other Asset Classes

Ulli Market Review Contact

By ZeroHedge

The much anticipated March FOMC minutes were released today (last Wed), and the minutes concluded exactly what I predicted in my last post titled “Is the Fed Trying to stop a “Market” that has gotten ahead of itself”. In it I said that the only reason they were raising rates unexpectedly is because they are trying to slow the bubble from getting any bigger.

The minutes confirmed that the February ‘out of nowhere talk’ of a rate hike, which led to a March rate hike, was all due to stocks and many other assets classes being a bubble.  FOMC officials are now openly admitting that their disastrous policies have created the largest asset bubbles in history, which has never been done before. On multiple occasions in years prior, many Fed officials, including former chair Greenspan, have openly said that it was very hard to spot asset bubbles in advance.

Now they are openly saying that they are seeing bubbles. Many current Fed officials share that same stupid viewpoint as Greenspan, including Kashkari, Fisher and Powell. Powell, just this past January at a conference in Chicago, said “low rates can lead to excessive leverage and broadly unsustainable asset prices – things that we watch carefully for and do not observe at this point.” So it was surprising to see the following In today’s minutes from the March meeting:

Read More

ETFs On The Cutline – Updated Through 04/07/2017

Ulli ETFs on the Cutline Contact

Below please find the latest High Volume ETFs Cutline report, which shows how far above or below their respective long-term trend lines (39 week SMA) my currently tracked ETFs are positioned.

This report covers the HV ETF Master List from Thursday’s StatSheet and includes 366 High Volume ETFs ETFs, defined as those with an average daily volume of more than $5 million, of which currently 241 (last week 231) are hovering in bullish territory. The yellow line separates those ETFs that are positioned above their trend line (%M/A) from those that have dropped below it.

Take a look:

The HV ETF Master Cutline Report            

In case you are not familiar with some of the terminology used in the reports, please read the Glossary of Terms.

If you missed the original post about the Cutline approach, you can read it here.

ETF Tracker Newsletter For April 7, 2017

Ulli ETF Tracker Contact

ETF Tracker StatSheet

https://theetfbully.com/?p=18769&preview=true

WAR MONGERING AND POOR JOBS REPORT EQUAL UNCERTAINTY

[Chart courtesy of MarketWatch.com]
  1. Moving the Markets

While stock futures took a dive last night after Trump’s unveiling that he ordered the US military to lob some 59 tomahawk cruise missiles into Syria, things turned around this morning as it appeared that the conflict will likely be contained—at least for the time being.

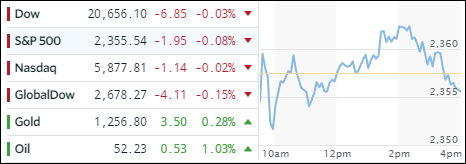
Then the markets got hit with the worst jobs report in 11 months as only 98,000 jobs were added but the unemployment rate dropped to 4.5%. After a brief pullback, the usual ramp occurred but upward momentum did not hold, and the major indexes sold off late in the day to close a tad below the unchanged line.

Overall, it was a session marked by confusion with only gold and oil hanging on to some of their early gains. Interest rates surged with the 10-year Treasury yield gaining 4 points or +1.71%. With higher yield, the US dollar got a little boost and added +0.54% to finally conquer the 101 level again after having vacillated the past 4 weeks below it. In a sign of bullishness, it also managed to close above 50-day M/A.

Read More

Weekly StatSheet For The ETF Tracker Newsletter – Updated Through 04/06/2017

Ulli ETF StatSheet Contact

ETF Data updated through Thursday, April 6, 2017

Methodology/Use of this StatSheet:

  1. From the universe of over 1,800 ETFs, I have selected only those with a trading volume of over $5 million per day (HV ETFs), so that liquidity and a small bid/ask spread are assured.
  2. Trend Tracking Indexes (TTIs)

Buy or Sell decisions for Domestic and International ETFs (section 1 and 2), are made based on the respective TTI and its position either above or below its long-term M/A (Moving Average). A crossing of the trend line from below accompanied by some staying power above constitutes a “Buy” signal. Conversely, a clear break below the line constitutes a “Sell” signal. Additionally, I use a 7.5% trailing stop loss on all positions in these categories to control downside risk.

  1. All other investment arenas do not have a TTI and should be traded based on the position of the individual ETF relative to its own respective trend line (%M/A). That’s why those signals are referred to as a “Selective Buy.” In other words, if an ETF crosses its own trendline to the upside, a “Buy” signal is generated. Since these areas tend to be more volatile, I recommend a wider trailing sell stop of 7.5% -10% depending on your risk tolerance.

If you are unfamiliar with some of the terminology, please see Glossary of Terms and new subscriber information in section 9.


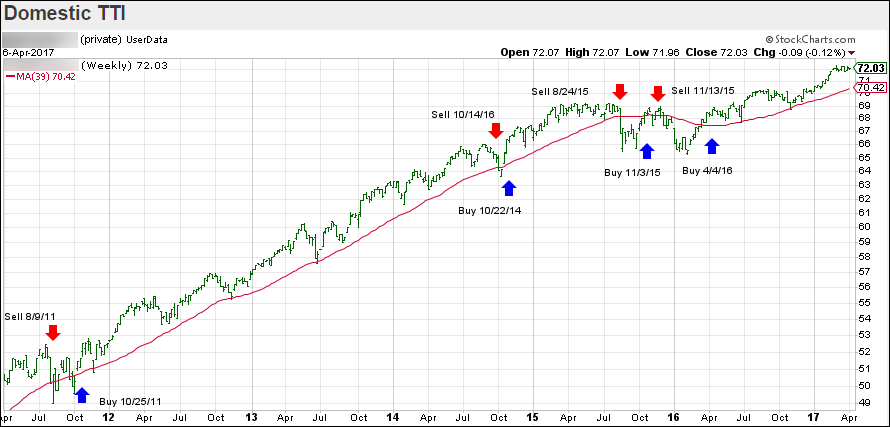
  1. DOMESTIC EQUITY ETFs: BUY — since 4/4/2016

Click on chart to enlarge

Our main directional indicator, the Domestic Trend Tracking Index (TTI-green line in the above chart) is positioned above its long-term trend line (red) by +2.37% after having generated a new Domestic Buy signal effective 4/4/2016 as posted.

Read More

Waiting For Uncertainty To Pass

Ulli Market Commentary Contact

[Chart courtesy of MarketWatch.com]
  1. Moving the Markets

An early rally attempt lost steam again late in the session with today’s spoiler being Secretary of State Tillerson, who took center stage and reversed his view from last week that the US had no interest in removing the Syrian president to now beating the war drums and announcing “that steps are underway to remove Assad,” and that the US is “considering an appropriate response to the Syrian government’s alleged use of chemical weapons.” Keep in mind, the emphasis is on “alleged.”

That took the starch out of any upward momentum, however, the major indexes managed to eke out a tiny gain. The 10-year Treasury yield went sideways and closed down 2 points or -0.85% hovering at a crucial support level, while Financials (XLF) gained +0.64% but remain stuck below their 50-day M/A.

The US dollar managed to squeeze out a gain for the 3rd day in a row as uncertainty remained high in regards to the outcome of Trump’s meeting with the Chinese president, which could have a dramatic effect on the dollar. Additional, we are waiting for Friday’s March employment report. Expectations are high due to the recent strong numbers released by ADP.

Read More