The Trump Trade Deteriorates

Ulli Market Commentary Contact

Thur pic

[Chart courtesy of MarketWatch.com]
  1. Moving the Markets

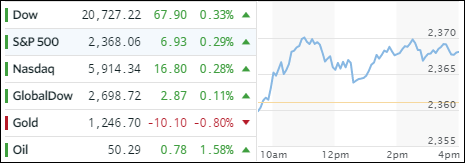
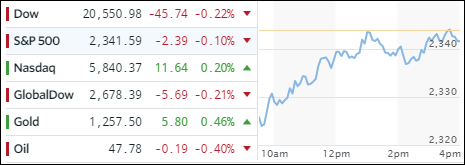
Things started out to the downside with the S&P 500 sliding almost 1% after Wall Street had some time to digest President-elect Trump’s press conference. Disappointment spread as he chose not to discuss details of his proposed economic policies that were the main driver behind the post-election rally. However, the indexes were magically lifted later on in the session saving equities from their worst day in 3 months.

This brings into question as to whether Trump can actually push his agenda through in a timely manner. If not, there is a high probability that market volatility will increase and with it the possibility of equities giving back some of their gains. After all, markets are in bubble territory when viewed based on economic fundamentals; however, they can stay in the mode until, one day, wishful thinking along with hope give way to reality. Historically, it always does, however, the timing of it is the big unknown.

In economic news, Fiat/Chrysler’s stock price crashed over 14% and trading was halted. The old cockroach theory was verified: If you see one, there are others in hiding. Turns out that Fiat has been accused of engaging in a similar scheme as Volkswagen by using cheating software to beat diesel emissions tests. Makes me wonder who is on deck next.

Read More

A Choppy Session Marked By A Late Rebound

Ulli Market Commentary Contact

Wed pic

[Chart courtesy of MarketWatch.com]
  1. Moving the Markets

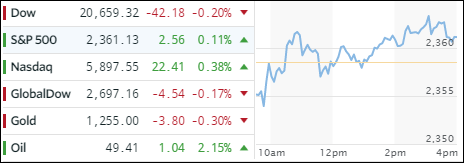
It was a wild ride for the major indexes as they vacillated above and below the unchanged line depending on the words of the moment during President-elect Trump’s first formal news conference since the election.

Case in point was the punishing effect on Biotech/Pharma stocks when Trump opined that that industry “was getting away with murder,” and that “we need new bidding procedures.” That’s all it took and Biotech/Pharma plunged the most since Brexit in June of 2016.

In the end, the S&P healthcare index ended the session down -1% after falling as much as 1.9% earlier on. The Biotech index was not as fortunate and sank -2.96%. That ended a 6-day winning streak for both indexes. Worries about the sector eased later in the session as Trump remained vague about any details on healthcare proposals.

Wall Street is in caution mode due to 2 big upcoming events namely the start of earnings season this Friday and Trumps inauguration a week later on January 20th. We now need to see some evidence that earnings are better than expected and can justify the market’s sugar high and that Trump will be able to deliver on his promises. Any disappointment and it may take a while longer for us to get to Dow 20k.

Read More

A Mixed Picture: S&P Flat, Dow Down And Nasdaq Up

Ulli Market Commentary Contact

tue-pic

[Chart courtesy of MarketWatch.com]
  1. Moving the Markets

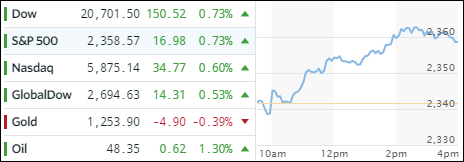
US oil got spanked again at the tune of -2.19% on top of yesterday’s 3.85% loss, hurting the energy sector and negating advances in the financial and healthcare arenas. The S&P was unchanged, but the Nasdaq managed to buck the trend again by advancing +0.36%.

Midday, it looked like the Dow might be successful with another attempt to conquer the 20k level by reaching 19,950, but selling pressure set in and down we went. I suspect that we may see more of this aimless meandering as traders are awaiting earnings season, and the January 20th inauguration, to get a better sense as to not just how but if Trump’s ambitious economic plan plays out as advertised.

In other words, the post-election exuberance has reached an end, and Wall Street appears to have settled into a wait-and-see mode before pushing the indexes further into bubble territory. Any suggestion that earnings are not what was expected, or Trump’s plans are not executable within a reasonable amount of time, and we’ll undoubtedly see a negative reaction in equities.

Read More

Slowing Momentum

Ulli Market Commentary Contact

mon-pic

[Chart courtesy of MarketWatch.com]
  1. Moving the Markets

At least for today, New Year momentum slowed as the major indexes predominantly hovered below the unchanged line and closed at their lows for the session. The exception was the Nasdaq, which managed to eke out a gain of +0.19%.

It was a tale of opposing market forces as technology strength was offset by weakness in financials and the energy sector. Oil took a beating and lost -3.85%. Bonds pulled back as Treasury yields rose slightly. The dollar came off its lofty level and, as a result, gold was the winner by adding +0.80%.

It seems right now we are in a holding pattern with earnings on deck as Wall Street is dealing with the political uncertainty as to whether Trump will be able to deliver on tax cuts, lighter regulation and fiscal stimulus.

Read More

One Man’s Opinion: January 2017 Earnings Are Going To Be A Bloodbath

Ulli Market Review Contact

OneMan'sOpinionBy EconMatters

We discuss a preview of January`s Earnings releases and how massive the gap down in most of these stocks will be when they report in a month. There have already been two earning`s guide downs from industrial companies this past week in UTX, and HON.

But with the run up in financials and energies for the last month we are going to experience big $5 chunks taken out of these stocks and massive after hours and pre-market gap downs that will cause entire sectors to sell off during earnings in January. It is just going to be brutal, expect 500 point down days in the Dow during this upcoming earnings period.

You have seasonal stocks that selloff every year like Apple and Amazon, as the 4th quarter is their best by far for sales and revenues. And you have energy companies with exorbitant p/e ratios like COP, XOM, CVH that are priced for $115 dollar oil not $55 oil that 4th quarter earnings releases are going to bring some fundamental realities back to investors of how overpriced these stocks are right here.

Read More

ETFs On The Cutline – Updated Through 01/06/2017

Ulli ETFs on the Cutline Contact

Below please find the latest High Volume ETFs Cutline report, which shows how far above or below their respective long-term trend lines (39 week SMA) my currently tracked ETFs are positioned.

This report covers the HV ETF Master List from Thursday’s StatSheet and includes 366 High Volume ETFs ETFs, defined as those with an average daily volume of more than $5 million, of which currently 234 (last week 201) are hovering in bullish territory. The yellow line separates those ETFs that are positioned above their trend line from those that have dropped below it.

Take a look:

The HV ETF Master Cutline Report            

In case you are not familiar with some of the terminology used in the reports, please read the Glossary of Terms.

If you missed the original post about the Cutline approach, you can read it here.