Nasdaq Slumps For Fifth Day As Economy Heats Up And Fed Cools Down

Ulli Market Commentary Contact

[Chart courtesy of MarketWatch.com]

  1. Moving the markets 

The Nasdaq Composite had another bad day on Thursday, dropping for the fifth time in a row — its worst run since last December.

Big tech stocks like Apple are not doing well this year, as investors are worried that they are too expensive and that the Fed might raise interest rates sooner than expected.

The economy, on the other hand, is doing fine, with strong job growth, low unemployment, and high service activity.

This boosted Treasury yields today, and made the market think that a rate hike in March is more likely. This pushed bond yields higher, with the 10-year breaking above its recent downtrend and touching 4% again but failing to close above it.

Stocks took a hit and the MAG7 (Microsoft, Amazon, Google, Facebook, Apple, Netflix, and Tesla) lost all their gains from last month. The Dow was the only index that managed to end slightly positive.

The Nasdaq and the Small Caps are down 3.5% this year, while the S&P is having its worst start since the 2008 crisis.

The dollar is on a roll, rising for the fifth day in a row, its best start to a year since 2005. Gold, however, recovered some of its recent losses and stayed above $2,040.

Financial conditions are getting tighter, which reminded ZeroHedge of what the Fed said in its minutes:

“Many participants remarked that an easing in financial conditions beyond what is appropriate could make it more difficult for the Committee to reach its inflation goal.”

Is the Fed trying to tell us that the market is too happy for its own good?

Read More

Nasdaq Leads Market Lower As Fed Remains Tight-Lipped On Rate Cuts

Ulli Market Commentary Contact

[Chart courtesy of MarketWatch.com]

  1. Moving the markets 

The Nasdaq Composite led the market lower for the third consecutive day, extending its worst daily drop since October 2023. Investors seemed to lose their appetite for the tech darlings of last year, which had soared on hopes of a dovish fed in 2024. But with the economy still struggling and no clear signal from the central bank on when it will start cutting rates, the wall street mood turned sour.

The Fed’s latest meeting minutes, released on Wednesday afternoon, did not help matters. They revealed that the fed was still reluctant to lower rates, despite its surprising shift from hawkish to dovish on December 13. The minutes said:

Participants generally stressed the importance of maintaining a careful and data-dependent approach to making monetary policy decisions and reaffirmed that it would be appropriate for policy to remain at a restrictive stance for some time until inflation was clearly moving down sustainably toward the committee’s objective.

The only silver lining was that the fed officials expected three rate cuts this year, but they also admitted that there was a lot of uncertainty around the timing of these cuts. So much for clarity.

As ZeroHedge noted, this year’s plunge in stocks and bonds was the worst global start to the year since 1999 (and yesterday was the biggest daily loss in global market value since December 2022.)

The dollar defied the weak economic data and rallied for the second day in a row, posting its best start to the year since 1997. The ISM manufacturing index stayed in contraction territory (below 50) for the 15th straight month and job openings fell to a three-year low, dragging the Economic Surprise Index lower. Ouch!

It was a dismal day on wall street, with small caps taking the biggest hit (down almost 3%), the Nasdaq sinking further (down over 1%), and the Dow holding up relatively better.

The Mag7 barely budged, and the most shorted stocks tanked at the open and never recovered. The S&P 500 had its first two-day decline to start the year since 2015, while the Russell 2000 touched a crucial support level.

Bond yields spiked early on, but then reversed course in the afternoon with the 10-year briefly crossing the 4% mark before falling back. Oil prices surged by almost 4% due to escalating tensions in the middle east.

For the markets to bounce back, the fed needs to be more decisive, and global uncertainty needs to calm down.

Is that too much to ask?

Read More

Stocks Start 2024 On A Negative Note, As Rates Rise And Data Disappoint

Ulli Market Commentary Contact

[Chart courtesy of MarketWatch.com]

  1. Moving the markets 

The new year started with a sour note for stocks, as they continued their downward slide from the end of 2023.

Rising interest rates and profit-taking after a stellar 2023 weighed on the market, especially the Nasdaq, which suffered its worst drop in more than two months. Apple was among the biggest losers, as Barclays cut its rating on the tech giant to underweight, citing slowing growth and rising competition.

The Dow fared better, thanks to some defensive stocks like Johnson & Johnson and Merck that held up well.

The market had a strong rally in 2023, as the economy proved resilient and inflation eased, while the Fed signaled a pause in rate hikes and hinted at possible rate cuts later this year. But don’t hold your breath for that, as the economic outlook is still uncertain.

The latest data showed that US manufacturing activity contracted in December, with orders falling and prices rising, while construction spending also missed expectations. These signs of weakness were reflected in the Economic Surprise Index, which measures how the data compares to forecasts.

You would think that weak data would push bond yields lower, but the opposite happened. Yields jumped and the dollar strengthened, as the 10-year Treasury yield broke above 3-week highs.

The most shorted stocks had a wild ride, as they plunged, soared, and plunged again, all in one day. Who can make sense of that?

The dollar’s strength was bad news for gold, but the precious metal managed to limit its losses for the day.

Traders are keen to see how the first five trading days of the year play out. Historically, they have been a good indicator of how the year will end. A positive start means a positive finish, and vice versa.

This chart shows the correlation. So, will the market turn around or keep falling?

Read More

ETFs On The Cutline – Updated Through 12/29/2023

Ulli ETFs on the Cutline Contact

Do you want to know which ETFs are hot and which ones are not? Then you need my High-Volume ETF Cutline report. It tells you how close or far each of the 311 ETFs I follow is from its long-term trend line (39-week SMA). These are the ETFs that trade more than $5 million a day, so they are not some obscure funds that nobody cares about.

The report is split into two parts: The winners that are above their trend line (%M/A), and the losers that are below it. The yellow line is the line of shame that separates them. You can see how many ETFs are in each group and how they have changed since the last report (270 vs. 273 current).

Take a peek:

The HV ETF Master Cutline Report

If you are confused by some of the terms we use, don’t panic. I have a helpful Glossary of Terms for you.

If you want to learn more about the Cutline method and how it can make you rich (or at least less poor), read my original post here.

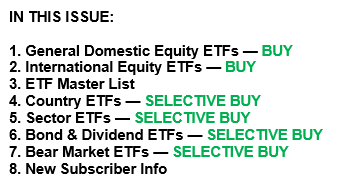
ETF Tracker Newsletter For December 29, 2023

Ulli ETF Tracker Contact

ETF Tracker StatSheet          

You can view the latest version here.

WALL STREET’S WILD RIDE: HOW AI, THE FED, AND GOLD SHAPED THE MARKETS IN 2023

[Chart courtesy of MarketWatch.com]

  1. Moving the markets 

The year 2023 failed to end with a bang for Wall Street, with the S&P 500 not soaring to new heights. However, it had a remarkable comeback from a dismal third quarter, while the Nasdaq outshone the rest with its tech-savvy portfolio. The “Magnificent 7” stocks, led by Nvidia and Microsoft, were the stars of the show, as they rode the wave of AI hype and innovation.

But not everyone was happy. The average stock lagged the indexes, as rising interest rates squeezed their profits and prospects. The bond market also had a roller-coaster ride, as the 10-year Treasury yield plunged from over 5% in October to below 3.9% in December. What caused this dramatic shift? The Fed, of course.

The Fed, which had been raising rates steadily for the past few years, suddenly changed its tune and signaled that it was done with tightening and might even start cutting rates multiple times in 2024.

This was music to the ears of traders, who hoped for a “soft landing” for the U.S. economy, avoiding a recession. But I think they are dreaming. The Fed is playing with fire, and we might get burned.

The Fed’s flip-flop also sparked a frenzy of buying in the global markets, which added a whopping $20 trillion in value in the last two months of the year, according to ZeroHedge. Most of that money went into stocks, especially in the emerging markets, while bonds also got a boost. The dollar, on the other hand, took a dive, as the Fed’s easing stance weakened its appeal.

The dollar’s decline was good news for gold, which had its best year since 2020, rising almost 14% to a new record high. Gold is the ultimate hedge against inflation, uncertainty, and chaos, and we had plenty of those in 2023. With the Fed’s loose policy, the global turmoil, and the AI revolution, gold might shine even brighter in 2024.

But will the stock market keep its momentum, or will it crash and burn like it did in 2000, after a similar buying panic?

That’s the million-dollar question, or should I say, the trillion-dollar question?

Read More

Weekly StatSheet For The ETF Tracker Newsletter – Updated Through 12/28/2023

Ulli ETF StatSheet Contact

ETF Data updated through Thursday, December 28, 2023

How to use this StatSheet:

  1. Out of the 1,800+ ETFs out there, I only pick the ones that trade over $5 million per day (HV ETFs), so you don’t get stuck with a lemon that nobody wants to buy or sell.
  1. Trend Tracking Indexes (TTIs)

These are the main indicators that tell you when to buy or sell Domestic and International ETFs (section 1 and 2). They do that by comparing their position to their long-term M/A (Moving Average). If they cross above, and stay there, it’s a green light to buy. If they fall below, and keep going, it’s a red light to sell. And to make sure you don’t lose your shirt if things go south, I also use a 12% trailing stop loss on all positions in these categories.

  1. All other investment areas don’t have a TTI and should be traded based on the position of each ETF relative to its own trend line (%M/A). That’s why I call them “Selective Buy.” In other words, if an ETF goes above its own trend line, you can buy it. But don’t forget to use a trailing sell stop of 12%, or less if you’re feeling nervous.

If some of these words sound like Greek to you, please check out the Glossary of Terms and new subscriber information in section 9.

  1. DOMESTIC EQUITY ETFs: BUY— since 11/21/2023

Click on chart to enlarge

This is our main compass, the Domestic Trend Tracking Index (TTI-green line in the above chart). It has broken above its long-term trend line (red) by +9.25% and is in “Buy” mode as posted.

Read More