
ETF Tracker StatSheet
You can view the latest version here.
WALL STREET’S WILD RIDE: HOW AI, THE FED, AND GOLD SHAPED THE MARKETS IN 2023
- Moving the markets
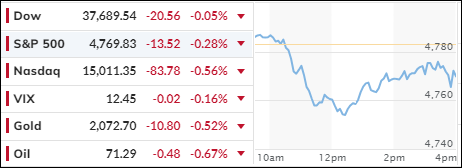
The year 2023 failed to end with a bang for Wall Street, with the S&P 500 not soaring to new heights. However, it had a remarkable comeback from a dismal third quarter, while the Nasdaq outshone the rest with its tech-savvy portfolio. The “Magnificent 7” stocks, led by Nvidia and Microsoft, were the stars of the show, as they rode the wave of AI hype and innovation.
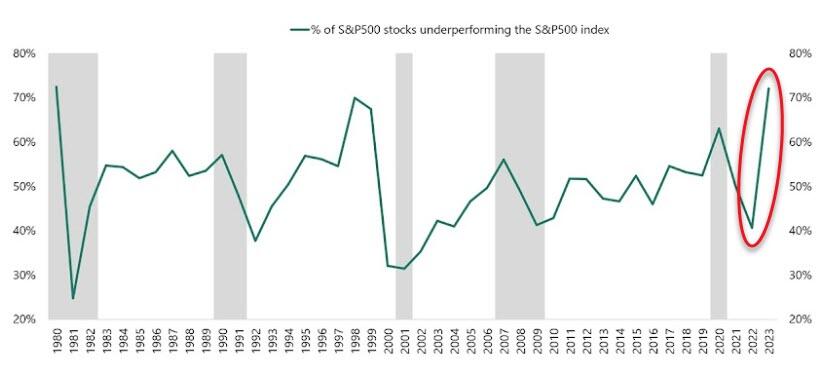
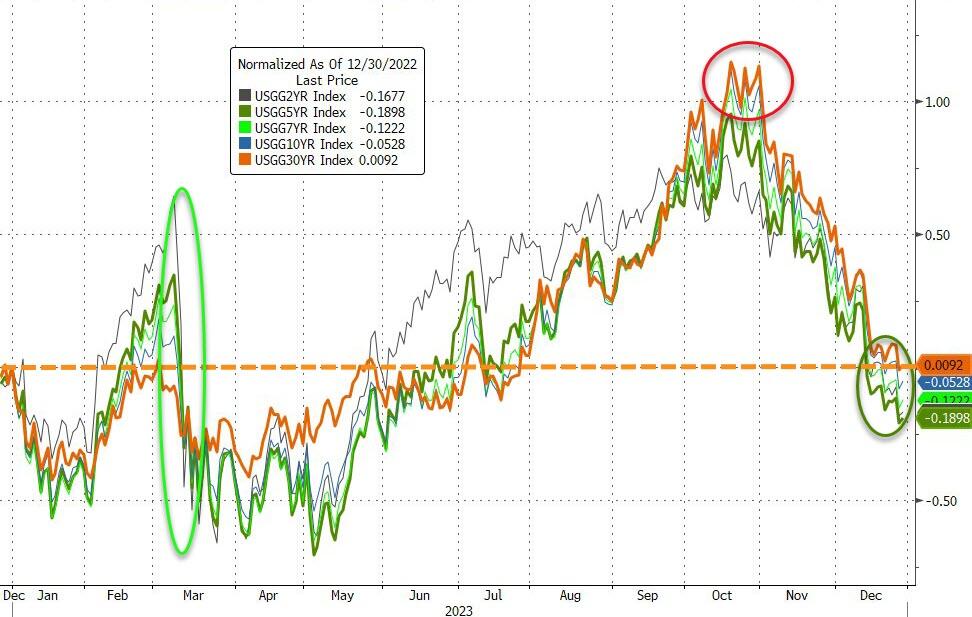
But not everyone was happy. The average stock lagged the indexes, as rising interest rates squeezed their profits and prospects. The bond market also had a roller-coaster ride, as the 10-year Treasury yield plunged from over 5% in October to below 3.9% in December. What caused this dramatic shift? The Fed, of course.
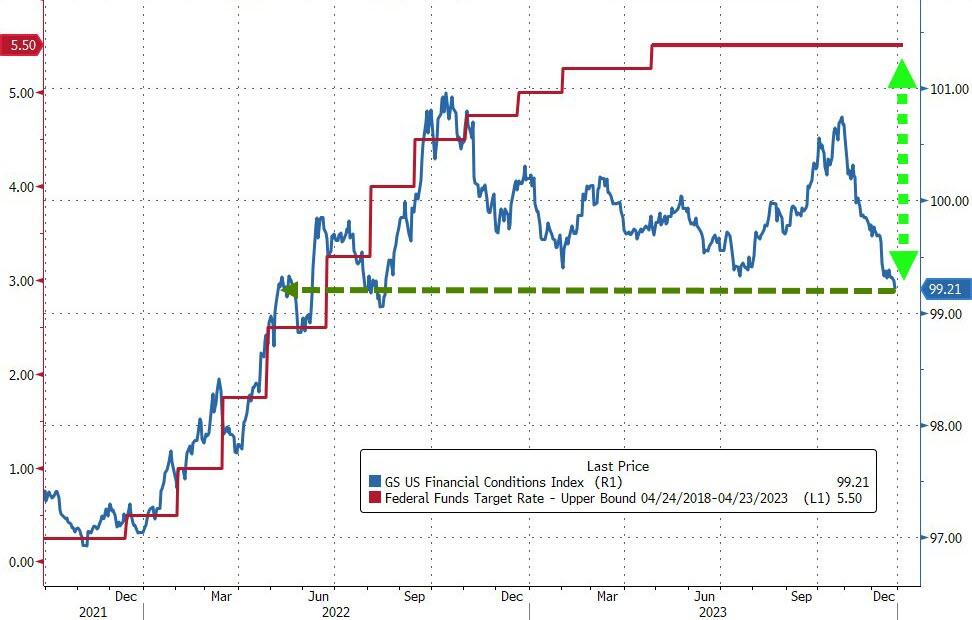
The Fed, which had been raising rates steadily for the past few years, suddenly changed its tune and signaled that it was done with tightening and might even start cutting rates multiple times in 2024.
This was music to the ears of traders, who hoped for a “soft landing” for the U.S. economy, avoiding a recession. But I think they are dreaming. The Fed is playing with fire, and we might get burned.
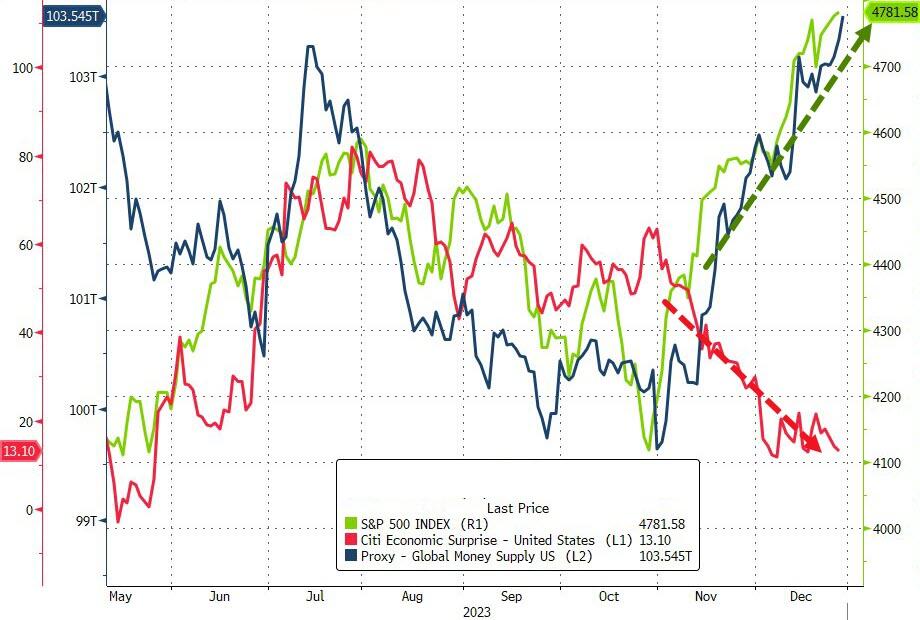
The Fed’s flip-flop also sparked a frenzy of buying in the global markets, which added a whopping $20 trillion in value in the last two months of the year, according to ZeroHedge. Most of that money went into stocks, especially in the emerging markets, while bonds also got a boost. The dollar, on the other hand, took a dive, as the Fed’s easing stance weakened its appeal.
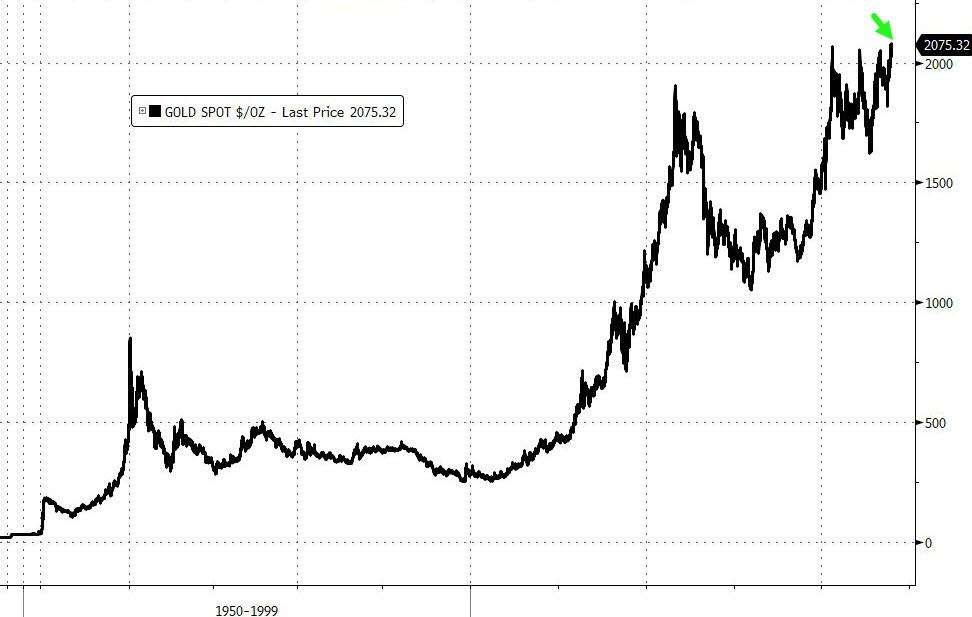
The dollar’s decline was good news for gold, which had its best year since 2020, rising almost 14% to a new record high. Gold is the ultimate hedge against inflation, uncertainty, and chaos, and we had plenty of those in 2023. With the Fed’s loose policy, the global turmoil, and the AI revolution, gold might shine even brighter in 2024.
But will the stock market keep its momentum, or will it crash and burn like it did in 2000, after a similar buying panic?
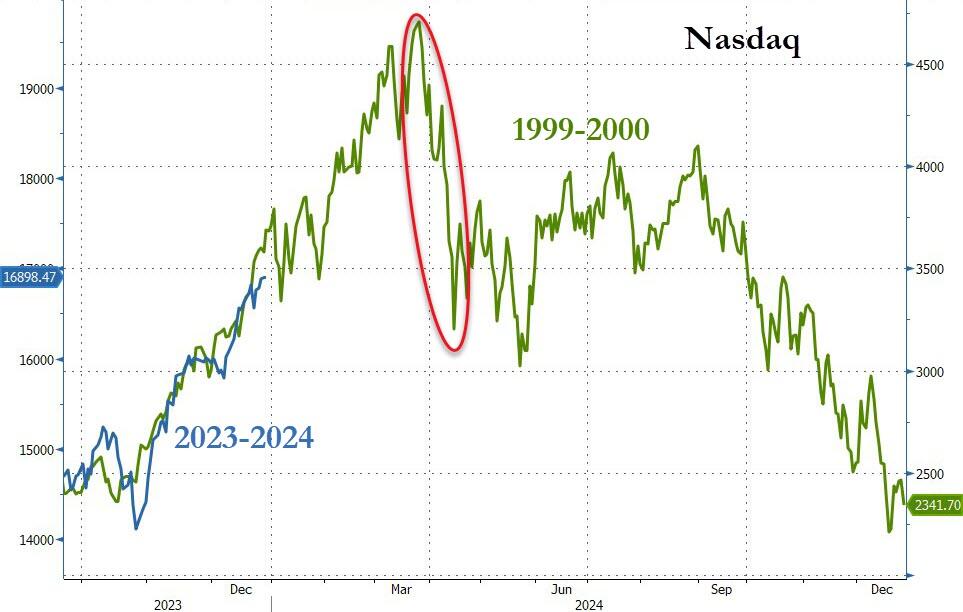
That’s the million-dollar question, or should I say, the trillion-dollar question?
2. Current “Buy” Cycles (effective 11/21/2023)
Our Trend Tracking Indexes (TTIs) have both crossed their trend lines with enough strength to trigger new “Buy” signals. That means, Tuesday, 11/21/2023, was the official date for these signals.
If you want to follow our strategy, you should first decide how much you want to invest based on your risk tolerance (percentage of allocation). Then, you should check my Thursday StatSheet and Saturday’s “ETFs on the Cutline” report for suitable ETFs to buy.
3. Trend Tracking Indexes (TTIs)
The market was volatile today, as the major indexes dropped sharply in the middle of the day but recovered some of their losses later. However, they still ended the day in negative territory, breaking their winning streak.
Our TTIs also experienced a similar trend and finished the year with a slight decline.
This is how we closed 12/29/2023:
Domestic TTI: +8.54% above its M/A (prior close +9.25%)—Buy signal effective 11/21/2023.
International TTI: +7.27% above its M/A (prior close +7.60%)—Buy signal effective 11/21/2023.
All linked charts above are courtesy of Bloomberg via ZeroHedge.
———————————————————-
WOULD YOU LIKE TO HAVE YOUR INVESTMENTS PROFESSIONALLY MANAGED?
Do you have the time to follow our investment plans yourself? If you are a busy professional who would like to have his portfolio managed using our methodology, please contact me directly to get more details.
Contact Ulli