
- Moving the markets
The Nasdaq Composite led the market lower for the third consecutive day, extending its worst daily drop since October 2023. Investors seemed to lose their appetite for the tech darlings of last year, which had soared on hopes of a dovish fed in 2024. But with the economy still struggling and no clear signal from the central bank on when it will start cutting rates, the wall street mood turned sour.
The Fed’s latest meeting minutes, released on Wednesday afternoon, did not help matters. They revealed that the fed was still reluctant to lower rates, despite its surprising shift from hawkish to dovish on December 13. The minutes said:
Participants generally stressed the importance of maintaining a careful and data-dependent approach to making monetary policy decisions and reaffirmed that it would be appropriate for policy to remain at a restrictive stance for some time until inflation was clearly moving down sustainably toward the committee’s objective.
The only silver lining was that the fed officials expected three rate cuts this year, but they also admitted that there was a lot of uncertainty around the timing of these cuts. So much for clarity.
As ZeroHedge noted, this year’s plunge in stocks and bonds was the worst global start to the year since 1999 (and yesterday was the biggest daily loss in global market value since December 2022.)
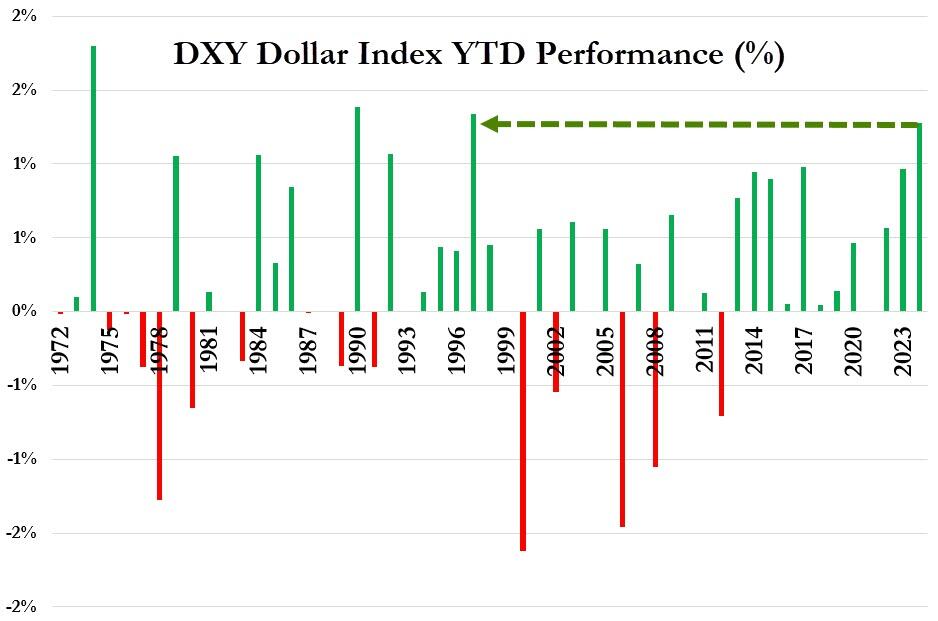
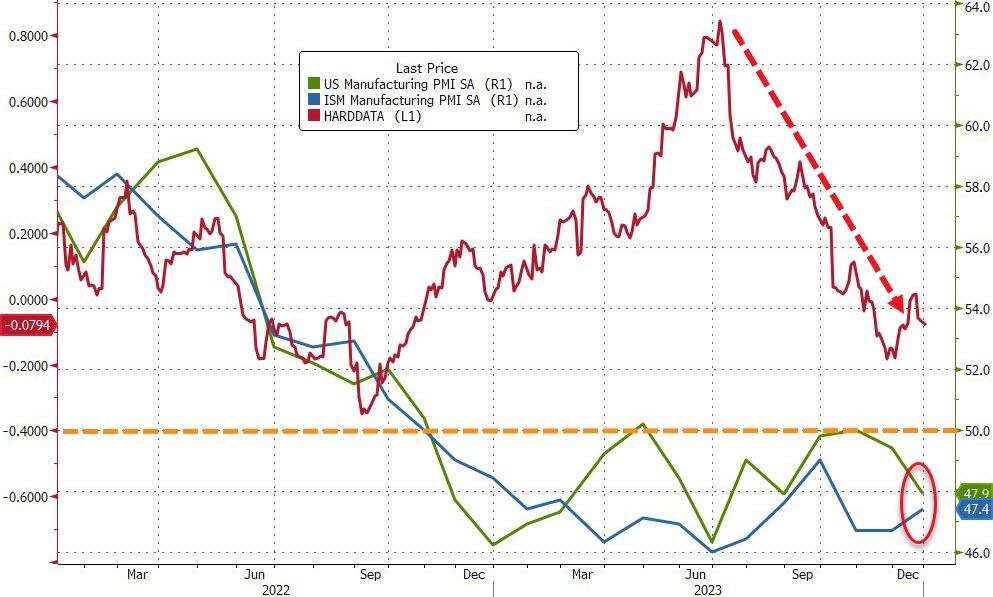
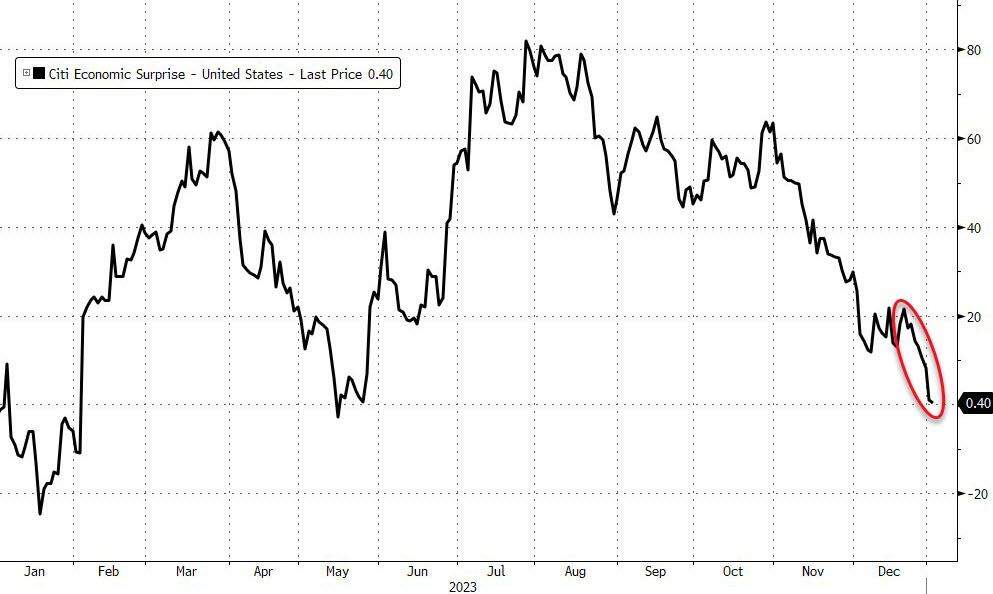
The dollar defied the weak economic data and rallied for the second day in a row, posting its best start to the year since 1997. The ISM manufacturing index stayed in contraction territory (below 50) for the 15th straight month and job openings fell to a three-year low, dragging the Economic Surprise Index lower. Ouch!
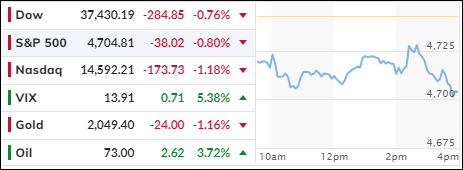
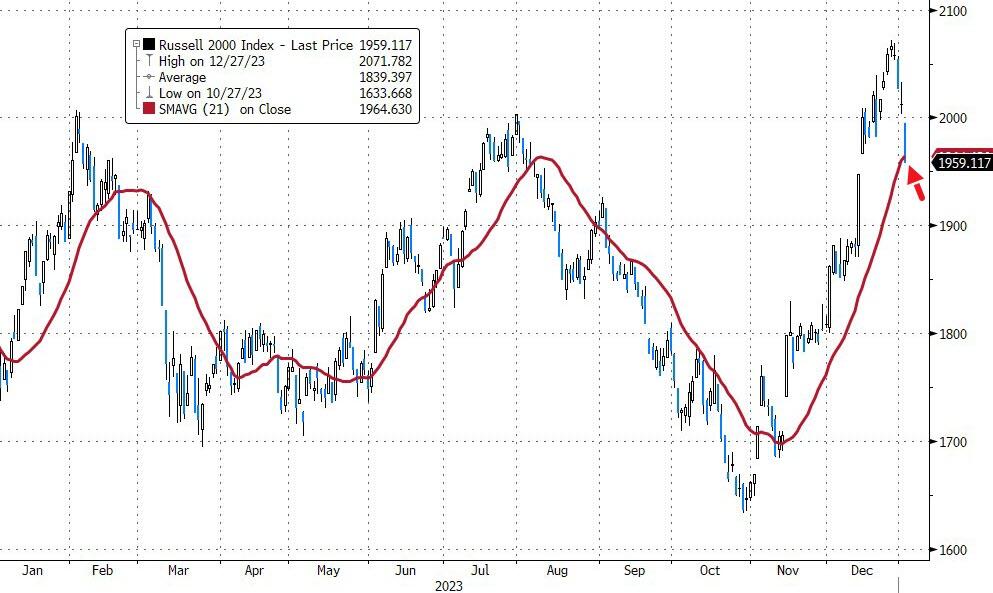
It was a dismal day on wall street, with small caps taking the biggest hit (down almost 3%), the Nasdaq sinking further (down over 1%), and the Dow holding up relatively better.
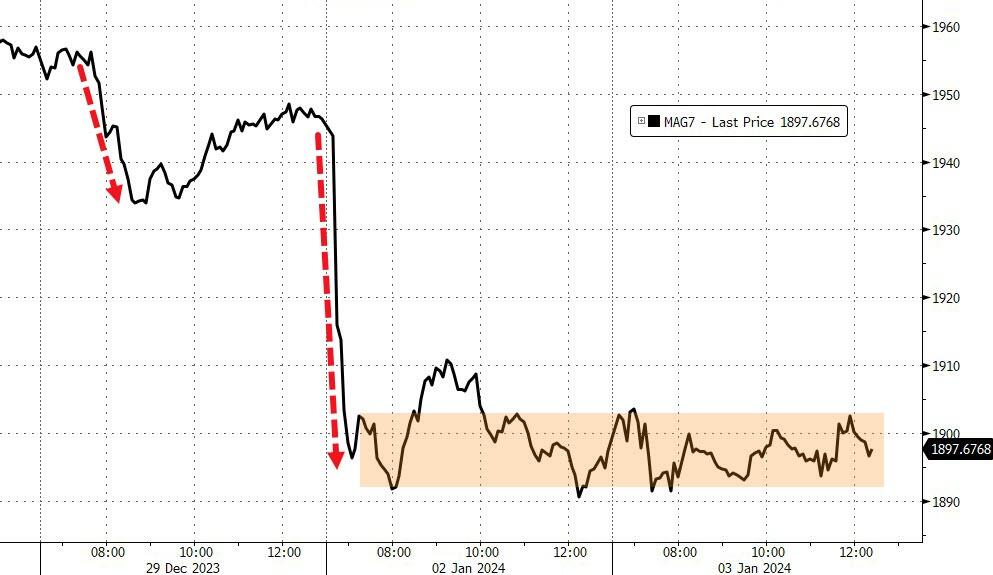
The Mag7 barely budged, and the most shorted stocks tanked at the open and never recovered. The S&P 500 had its first two-day decline to start the year since 2015, while the Russell 2000 touched a crucial support level.
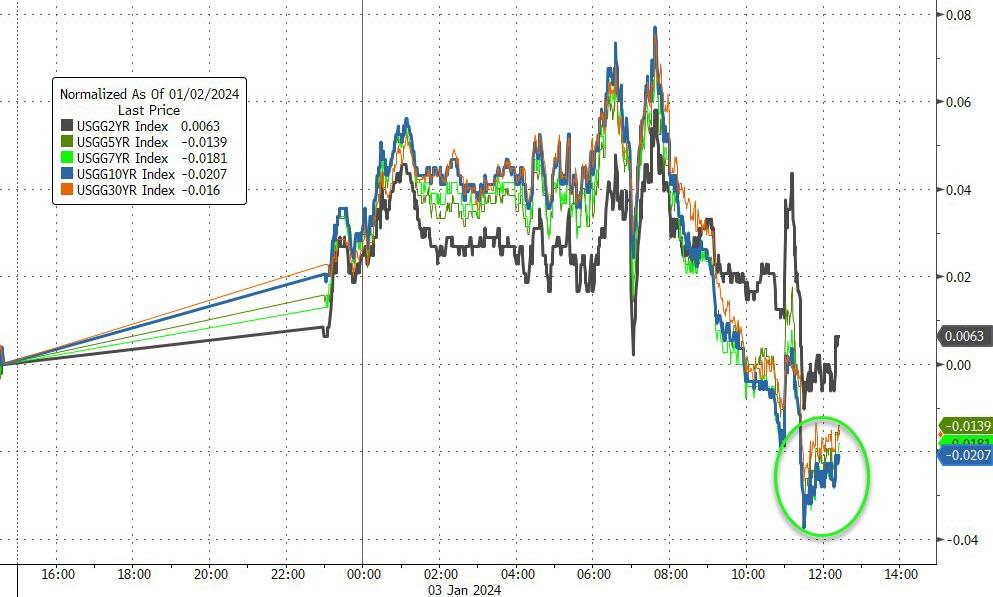
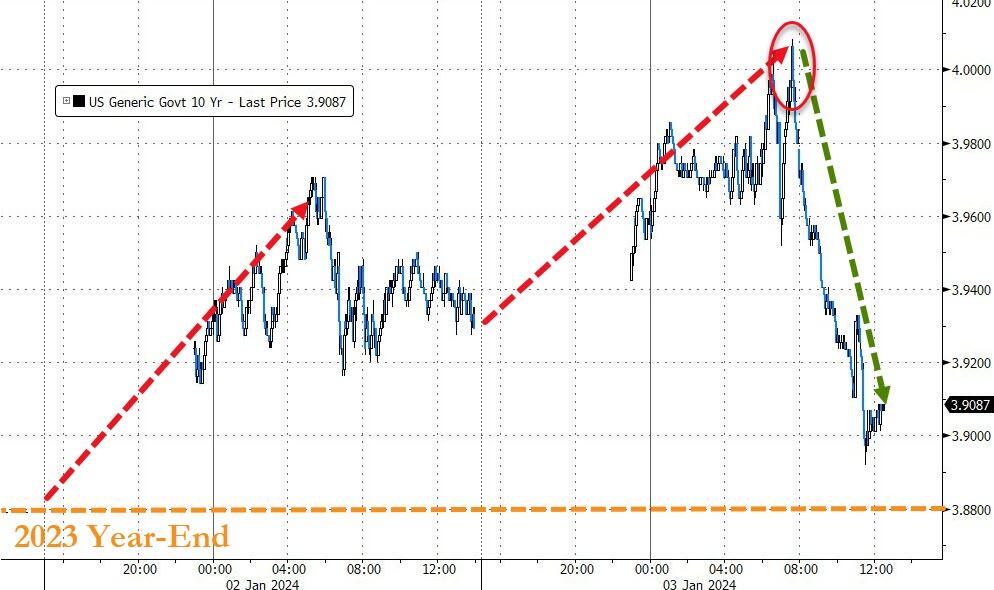
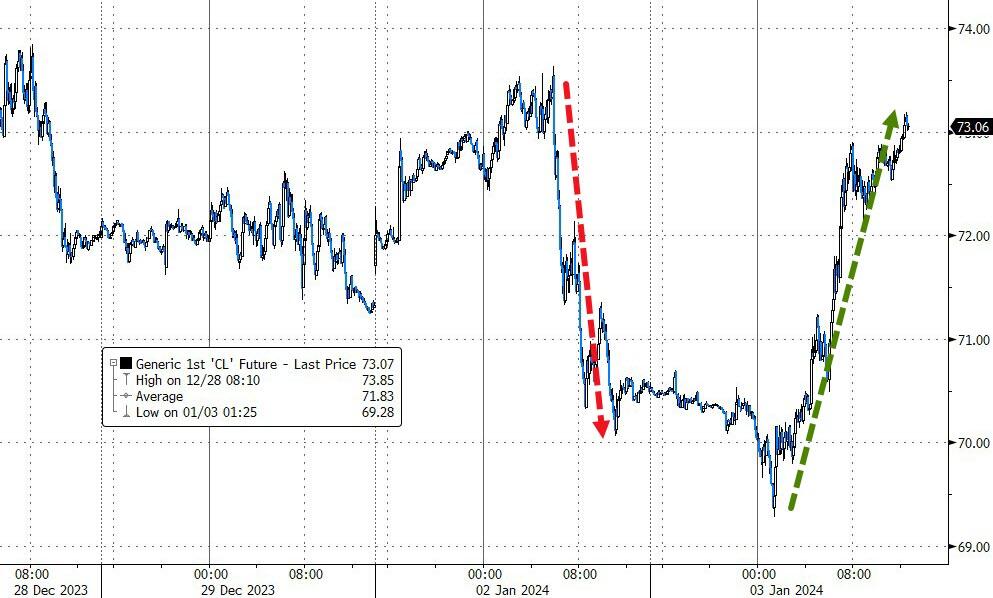
Bond yields spiked early on, but then reversed course in the afternoon with the 10-year briefly crossing the 4% mark before falling back. Oil prices surged by almost 4% due to escalating tensions in the middle east.
For the markets to bounce back, the fed needs to be more decisive, and global uncertainty needs to calm down.
Is that too much to ask?
2. Current “Buy” Cycles (effective 11/21/2023)
Our Trend Tracking Indexes (TTIs) have both crossed their trend lines with enough strength to trigger new “Buy” signals. That means, Tuesday, 11/21/2023, was the official date for these signals.
If you want to follow our strategy, you should first decide how much you want to invest based on your risk tolerance (percentage of allocation). Then, you should check my Thursday StatSheet and Saturday’s “ETFs on the Cutline” report for suitable ETFs to buy.
3. Trend Tracking Indexes (TTIs)
The markets were in a bad mood today, as everything went down from the start to the end of the trading day.
Our TTIs corrected as well but are maintaining their bullish stance.
This is how we closed 1/3/2024:
Domestic TTI: +6.97% above its M/A (prior close +8.58%)—Buy signal effective 11/21/2023.
International TTI: +6.15% above its M/A (prior close +7.02%)—Buy signal effective 11/21/2023.
All linked charts above are courtesy of Bloomberg via ZeroHedge.
Contact Ulli